数据分析实例--R语言如何对垃圾邮件进行分类
内容导读
互联网集市收集整理的这篇技术教程文章主要介绍了数据分析实例--R语言如何对垃圾邮件进行分类,小编现在分享给大家,供广大互联网技能从业者学习和参考。文章包含2716字,纯文字阅读大概需要4分钟。
内容图文

Coursera上数据分析实例 --R语言如何对垃圾邮件进行分类
Structure of a Data Analysis
- 数据分析的步骤
l Define the question
l Define the ideal data set
l Determine what data you can access
l Obtain the data
l Clean the data
l Exploratory data analysis
l Statistical prediction/model
l Interpret results
l Challenge results
l Synthesize/write up results
l Create reproducible code
- A sample
1) 问题.
Can I automatically detect emails that are SPAM or not?
2) 具体化问题
Can I use quantitative characteristics of the emails to classify them as SPAM/HAM?
3) 获取数据
http://search.r-project.org/library/kernlab/html/spam.html
4) 取样
#if it isn‘t installed,please install the package first.
library(kernlab)
data(spam)
#perform the subsampling
set.seed(3435)
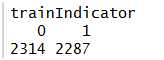
trainIndicator =rbinom(4601,size = 1,prob = 0.5)
table(trainIndicator)
trainSpam = spam[trainIndicator == 1, ]
testSpam = spam[trainIndicator == 0, ]
5) 初步分析
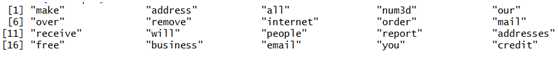
a) Names:查看的列名
names(trainSpam)
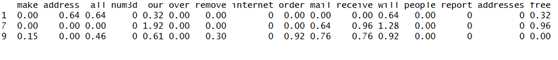
b) Head:查看前六行
head(trainSpam)
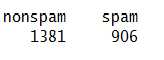
c) Summaries:汇总
table(trainSpam$type)
d) Plots:画图,查看垃圾邮件及非垃圾邮件的分布
plot(trainSpam$capitalAve ~ trainSpam$type)
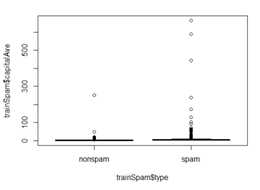
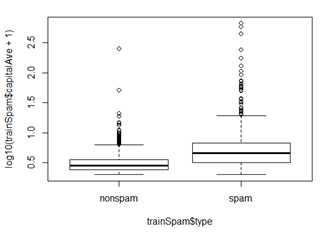
上图分布不明显,我们取对数后,再看看
plot(log10(trainSpam$capitalAve + 1) ~ trainSpam$type)
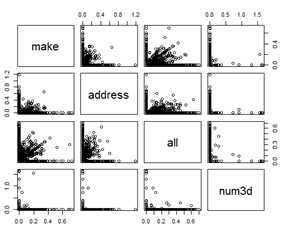
e) 寻找预测的内在关系
plot(log10(trainSpam[, 1:4] + 1))
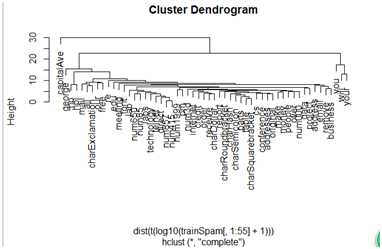
f) 试用层次聚类
hCluster = hclust(dist(t(trainSpam[, 1:57])))
plot(hCluster)
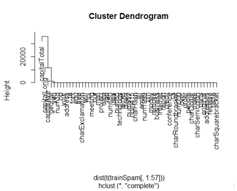
太乱了.不能发现些什么。老方法不是取log看看
hClusterUpdated = hclust(dist(t(log10(trainSpam[, 1:55] + 1))))
plot(hClusterUpdated)
6) 统计预测及建模
trainSpam$numType = as.numeric(trainSpam$type) - 1
costFunction = function(x, y) sum(x != (y > 0.5))
cvError = rep(NA, 55)
library(boot)
for (i in 1:55) {
lmFormula = reformulate(names(trainSpam)[i], response = "numType")
glmFit = glm(lmFormula, family = "binomial", data = trainSpam)
cvError[i] = cv.glm(trainSpam, glmFit, costFunction, 2)$delta[2]
}
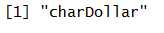
## Which predictor has minimum cross-validated error?
names(trainSpam)[which.min(cvError)]
7) 检测
## Use the best model from the group
predictionModel = glm(numType ~ charDollar, family = "binomial", data = trainSpam)
## Get predictions on the test set
predictionTest = predict(predictionModel, testSpam)
predictedSpam = rep("nonspam", dim(testSpam)[1])
## Classify as `spam‘ for those with prob > 0.5
predictedSpam[predictionModel$fitted > 0.5] = "spam"
## Classification table 查看分类结果
table(predictedSpam, testSpam$type)
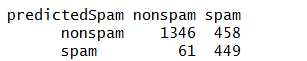
分类错误率:0.2243 =(61 + 458)/(1346 + 458 + 61 + 449)
8) Interpret results(结果解释)
The fraction of charcters that are dollar signs can be used to predict if an email is Spam
Anything with more than 6.6% dollar signs is classified as Spam
More dollar signs always means more Spam under our prediction
Our test set error rate was 22.4%
9) Challenge results
10) Synthesize/write up results
11) Create reproducible code
原文:http://www.cnblogs.com/colinqin/p/6939981.html
内容总结
以上是互联网集市为您收集整理的数据分析实例--R语言如何对垃圾邮件进行分类全部内容,希望文章能够帮你解决数据分析实例--R语言如何对垃圾邮件进行分类所遇到的程序开发问题。 如果觉得互联网集市技术教程内容还不错,欢迎将互联网集市网站推荐给程序员好友。
内容备注
版权声明:本文内容由互联网用户自发贡献,该文观点与技术仅代表作者本人。本站仅提供信息存储空间服务,不拥有所有权,不承担相关法律责任。如发现本站有涉嫌侵权/违法违规的内容, 请发送邮件至 gblab@vip.qq.com 举报,一经查实,本站将立刻删除。
内容手机端
扫描二维码推送至手机访问。