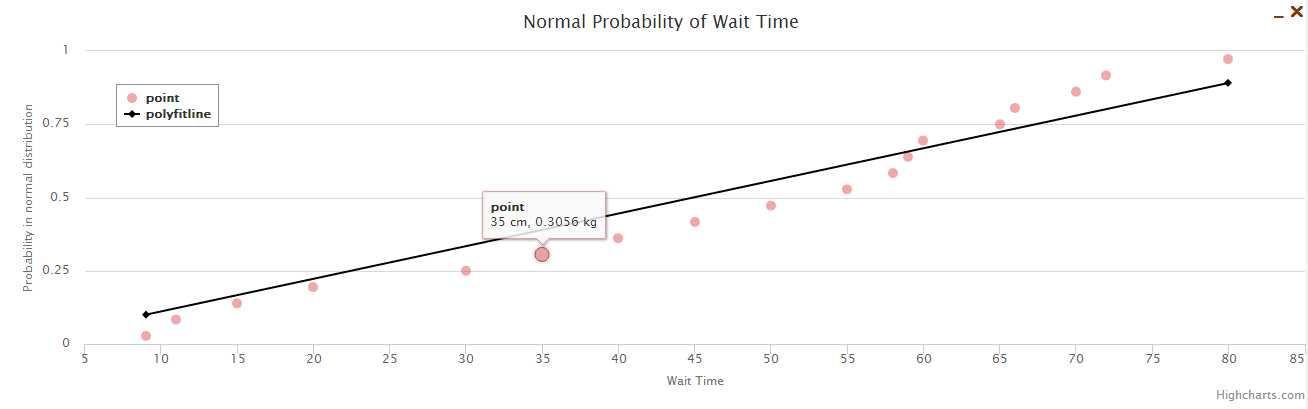
6、基于highcharts实现的线性拟合,计算部分在java中实现,画的是正态概率图
内容导读
互联网集市收集整理的这篇技术教程文章主要介绍了6、基于highcharts实现的线性拟合,计算部分在java中实现,画的是正态概率图,小编现在分享给大家,供广大互联网技能从业者学习和参考。文章包含6432字,纯文字阅读大概需要10分钟。
内容图文

1、坐标点类
            package
             cn.test.domain;


            public
            class
             Point {

            double
             x;

            double
             y;


            public
             Point(){

    }


            public Point(double x, double y) {
        super();
        this.x = x;
        this.y = y;
    }

    publicdouble getX() {
        return x;
    }

    publicvoid setX(double x) {
        this.x = x;
    }

    publicdouble getY() {
        return y;
    }

    publicvoid setY(double y) {
        this.y = y;
    }
}
2、拟合类,带计算部分
            package
             cn.test.normcdf;


            import
             java.io.IOException;

            import
             java.text.NumberFormat;

            import
             java.util.ArrayList;

            import
             java.util.Collections;

            import
             java.util.List;


            import
             javax.servlet.ServletException;

            import
             javax.servlet.http.HttpServlet;

            import
             javax.servlet.http.HttpServletRequest;

            import
             javax.servlet.http.HttpServletResponse;


            import
             net.sf.json.JSONArray;

            import
             net.sf.json.JSONObject;


            import
             org.apache.commons.math3.distribution.NormalDistribution;


            import
             cn.test.domain.Point;


            public
            class TestNormCdf extends HttpServlet {

    private ArrayList<Double> cyis = null;
    private ArrayList<Double> axis = null;

    publicvoid doGet(HttpServletRequest request, HttpServletResponse response)
            throws ServletException, IOException {
        axis = new ArrayList<Double>();
        cyis = new ArrayList<Double>();
        // 初始化横坐标值
        axis = initial(axis);
        /* axis = stand(axis); */// 计算纵坐标值
        //NormalDistribution normal = new NormalDistribution();
        // 先排序        Collections.sort(axis);
        int n = axis.size();
/*        for (int i = 0; i < axis.size(); i++) {
            cyis.add(normal.inverseCumulativeProbability((i + 1 - 0.5) / n));
        }*/for (int i = 0; i < axis.size(); i++) {
            cyis.add((i + 1 - 0.5) / n);
        }

          double sumX = getSum(axis);
          double sumY = getSum(cyis);
          double sumP2X = getPowSum(axis);
          double sumXY = getSumXY(axis, cyis);
          double a =(sumXY - (1 / axis.size()) * sumX * sumY) / (sumP2X - (1 /axis.size()) * sumX * sumX);
          double b = (1 / axis.size()) * (sumY - a*sumX);
          double pointx1 = axis.get(0);
          double pointx2 = axis.get(n - 1);
          double pointy1 = b+a * pointx1;
          double pointy2 = b+a * pointx2;
        //cyis = stand2(cyis);/*double x1 = axis.get((int) (n * 0.75));
        double x2 = axis.get((int) (n * 0.25));
        double y1 = cyis.get((int) (n * 0.75));
        double y2 = cyis.get((int) (n * 0.25));
        double dx = x1 - x2;
        double dy = y1 - y2;
        double a = dy / dx;
        double pointx1 = axis.get(0);
        double pointx2 = axis.get(n - 1);
        double centreX = 0.5 * (x1 + x2);
        double centreY = 0.5 * (y1 + y2);
        double pointy1 = centreY - a * (centreX - pointx1);
        double pointy2 = centreY + a * (pointx2 - centreX);*/
        Double[][] array = new Double[axis.size() + 2][2];
        NumberFormat ddf1 = NumberFormat.getNumberInstance();
        ddf1.setMaximumFractionDigits(4);
        for (int i = 0; i < axis.size(); i++) {
            array[i][0] = Double.valueOf(ddf1.format(axis.get(i)));
            array[i][1] = Double.valueOf(ddf1.format(cyis.get(i)));
        }
        array[axis.size()][0] = Double.valueOf(ddf1.format(pointx1));
        array[axis.size()][1] = Double.valueOf(ddf1.format(pointy1));
        array[axis.size() + 1][0] = Double.valueOf(ddf1.format(pointx2));
        array[axis.size() + 1][1] = Double.valueOf(ddf1.format(pointy2));
        response.getWriter().write(JSONArray.fromObject(array).toString());
    }

    public ArrayList<Double> stand2(ArrayList<Double> cyis) {
        int n = cyis.size();
        NormalDistribution normal = new NormalDistribution();
        for (int i = 0; i < cyis.size(); i++) {
            cyis.set(i, normal.cumulativeProbability(cyis.get(i)));
        }
        return cyis;
    }

    /*
     * public ArrayList<Double> stand(ArrayList<Double> list) { double average =
     * getAverage(list); double std = getStdVariance(list); for (int i = 0; i <
     * list.size(); i++) { list.set(i, (list.get(i) - average) / std); } return
     * list; }
     *
     * public double getStdVariance(ArrayList<Double> list) { double std = 0.0;
     * double average = getAverage(list); for (int i = 0; i < list.size(); i++)
     * { std += Math.pow((list.get(i) - average), 2); } return std /
     * list.size(); }
     *
     * public double getAverage(ArrayList<Double> list) { return getSum(list) /
     * list.size(); }
     */publicdouble getSum(ArrayList<Double> list) {
        double sum = 0.0;
        for (Double value : list) {
            sum += value;
        }
        return sum;
    }

    publicdouble getSumXY(ArrayList<Double> X, ArrayList<Double> Y) {
        double sum = 0.0;
        for (int i = 0; i < X.size(); i++) {
            sum += X.get(i) * Y.get(i);
        }
        return sum;
    }

    publicdouble getPowSum(ArrayList<Double> list) {
        double sum = 0.0;
        for (Double value : list) {
            sum += Math.pow(value, 2);
        }
        return sum;
    }

    public ArrayList<Double> initial(ArrayList<Double> axis) {
        axis = new ArrayList<Double>();
        axis.add(9.0);
        axis.add(11.0);
        axis.add(15.0);
        axis.add(20.0);
        axis.add(30.0);
        axis.add(40.0);
        axis.add(35.0);
        axis.add(80.0);
        axis.add(50.0);
        axis.add(60.0);
        axis.add(55.0);
        axis.add(45.0);
        axis.add(65.0);
        axis.add(70.0);
        axis.add(58.0);
        axis.add(72.0);
        axis.add(66.0);
        axis.add(59.0);
        return axis;
    }

    publicvoid doPost(HttpServletRequest request, HttpServletResponse response)
            throws ServletException, IOException {
        doGet(request, response);
    }

}
3、html部分代码
            <
            script
            src
            ="http://cdn.hcharts.cn/jquery/jquery-1.8.3.min.js"
            ></
            script
            >
            <
            script
            src
            ="${pageContext.request.contextPath}/js/highcharts.js"
            ></
            script
            >
            <
            script
            type
            ="text/javascript"
            >

          $(
            function
            (){
              $.post(
            "
            /Test_Polyfit/TestNormCdf
            "
            ,
            null
            ,
            function
            (data){

            var
             array
            =
            eval(data);
                          $(
            "
            #container
            "
            ).highcharts({
                              chart:{
                                  zoomType:
            ‘
            xy
            ‘

                              },
                              title:{
                                  text:
            ‘
            Normal Probability of Wait Time
            ‘

                              },
                              xAxis:{
                                  title:{
                                      enabled:
            true
            ,
                                      text:
            ‘
            Wait Time
            ‘

                                  },
                                  startOnTick:
            true
            ,
                                endOnTick:
            true
            ,
                                showLastLabel:
            true

                              },
                              yAxis:{
                                  title:{
                                      text:
            ‘
            Probability in normal distribution
            ‘

                                  },
                                  min:
            0
            ,
                                  max:
            1
            ,
                                  staggerLines:
            20
            ,
                                 allowDecimals:
            true

                              },
                              legend:{
                                  layout:
            ‘
            vertical
            ‘
            ,
                                  align:
            ‘
            left
            ‘
            ,
                                  verticalAlign:
            ‘
            top
            ‘
            ,
                                  x:
            100
            ,
                                y:
            70
            ,
                                floating:
            true
            ,
                                backgroundColor:
            ‘
            #FFFFFF
            ‘
            ,
                                borderWidth:
            1

                              },
                               plotOptions: {
                                    scatter: {
                                        marker: {
                                            radius:
            5
            ,
                                            states: {
                                                hover: {
                                                    enabled:
            true
            ,
                                                    lineColor:
            ‘
            rgb(100,100,100)
            ‘

                                                }
                                            }
                                        },
                                        states: {
                                            hover: {
                                                marker: {
                                                    enabled:
            false

                                                }
                                            }
                                        },
                                        tooltip: {
                                            headerFormat:
            ‘
            <b>{series.name}</b><br>
            ‘
            ,
                                            pointFormat:
            ‘
            {point.x} cm, {point.y} kg
            ‘

                                        }
                                    }
                            },
                             series: [{
                                type:
            ‘
            scatter
            ‘
            ,
                                name:
            ‘
            point
            ‘
            ,
                                color:
            ‘
            rgba(223, 83, 83, .5)
            ‘
            ,
                                data: array
                            },{
                                type:
            ‘
            line
            ‘
            ,
                                name:
            ‘
            polyfitline
            ‘
            ,
                                color:
            ‘
            black
            ‘
            ,
                                data: [array.pop(),array.pop()]
                            }]
                          });
                  });
              });


            </
            script
            >
            </
            head
            >
            <
            body
            >
            <
            div
            id
            ="container"
            ></
            div
            >
4、最后实现的效果
原文:http://www.cnblogs.com/weizhen/p/5823877.html
内容总结
以上是互联网集市为您收集整理的6、基于highcharts实现的线性拟合,计算部分在java中实现,画的是正态概率图全部内容,希望文章能够帮你解决6、基于highcharts实现的线性拟合,计算部分在java中实现,画的是正态概率图所遇到的程序开发问题。 如果觉得互联网集市技术教程内容还不错,欢迎将互联网集市网站推荐给程序员好友。
内容备注
版权声明:本文内容由互联网用户自发贡献,该文观点与技术仅代表作者本人。本站仅提供信息存储空间服务,不拥有所有权,不承担相关法律责任。如发现本站有涉嫌侵权/违法违规的内容, 请发送邮件至 gblab@vip.qq.com 举报,一经查实,本站将立刻删除。
内容手机端
扫描二维码推送至手机访问。
来源:【匿名】