首页 / ECHARTS / Echarts柱形图 实例
Echarts柱形图 实例
内容导读
互联网集市收集整理的这篇技术教程文章主要介绍了Echarts柱形图 实例,小编现在分享给大家,供广大互联网技能从业者学习和参考。文章包含5371字,纯文字阅读大概需要8分钟。
内容图文

<!
DOCTYPE html
>
<
html
lang
="en"
>
<
head
>
<
meta
charset
="UTF-8"
>
<
meta
name
="viewport"
content
="width=device-width, initial-scale=1.0"
>
<
title
>Document</title><script src="echarts.min.js"></script></head><body><div id="a" style="width: 500px; height: 500px;"></div></body><script>//绑定divvar myChart = echarts.init(document.getElementById(‘a‘))
var dataAxis = [‘点‘, ‘击‘, ‘柱‘, ‘子‘, ‘或‘, ‘者‘, ‘两‘, ‘指‘, ‘在‘, ‘触‘, ‘屏‘, ‘上‘, ‘滑‘, ‘动‘, ‘能‘, ‘够‘, ‘自‘, ‘动‘, ‘缩‘, ‘放‘];
var data = [220, 182, 191, 234, 290, 330, 310, 123, 442, 321, 90, 149, 210, 122, 133, 334, 198, 123, 125, 220];
// var yMax = 500;
// var dataShadow = [];//这个第二条柱子合并产生阴影,循环的是上面定义的变量然后根据数据多少来给下面阴影加数据
// for (var i = 0; i < data.length; i++) {
// dataShadow.push(yMax);
// }
option = {
// 标题 title: {
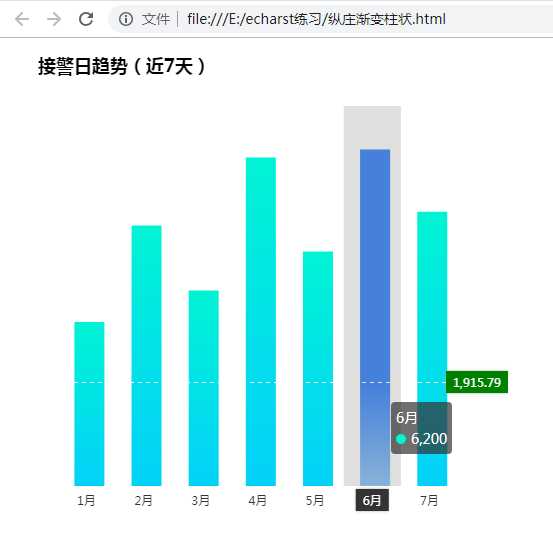
// 主标题 text: ‘接警日趋势(近7天)‘,
//主标题内容样式 textStyle:{
color:‘#000‘
},
// 副标题 subtext: ‘‘,
// 副标题内容样式 subtextStyle:{
color:‘#bbb‘
},
//标题位置,因为图形是是放在一个dom中,因此用padding属性来定位 padding:[10,0,0,30]
},
// 鼠标放上显示提示 tooltip: {
trigger: ‘axis‘, //触发类型 ‘item‘数据项图形触发,主要在散点图,饼图等无类目轴的图表中使用,‘axis‘坐标轴触发,主要在柱状图,折线图等会使用类目轴的图表中使用。 axisPointer: { //坐标轴指示器,坐标轴触发有效 type: ‘cross‘, //默认为直线,可选line shadow cross crossStyle: {
color: ‘#fff‘
}
}
},
// x轴 xAxis: {
show:true,
data: dataAxis,
axisPointer: { //写到X轴就是给X轴改的鼠标放上后的样式 type: ‘shadow‘,
},
// 坐标轴标签 axisLabel: {
inside: true,
textStyle: {
color: ‘#fff‘
}
},
//X坐标刻度 axisTick: {
show: false, //坐标轴线是否显示 inside:true, //坐标轴线是否朝内
},
//X坐标标签 就是文字 axisLabel:{
show:true, //坐标标签是否显示 inside:false, //坐标标签是否朝内 },
//grid 区域中的分隔线 axisLine: {
show: false
},
// 网格区域 splitArea:{
show:false
},
data: ["1月","2月","3月","4月","5月","6月","7月"],
z: 10
},
// y轴 yAxis: {
show:false, //是否显示 position:‘right‘, //显示位置 offset:0, //y轴相对于默认位置的偏移 type:‘value‘, //轴的类型 name:‘销量‘, //轴的名称 nameLocation:‘end‘,
// 坐标名称的样式 颜色 内边距 字体大小等 nameTextStyle:{
color:"#000",
padding:[5,0,0,10],
},
nameGap:20, //坐标名称和轴线的距离// nameRotate:270, //坐标名字的旋转// 坐标轴 轴线 axisLine: {
show: true,
// 箭头 symbol:[‘none‘,‘arrow‘], //[‘none‘,‘arrow‘]这是只在末端显示箭头,‘arrow‘两端都显示箭头 ‘none‘就是不显示 symbolSize:[8, 8] , //---箭头大小 symbolOffset:[0,7], //---箭头位置//线 lineStyle:{
color:‘green‘, //线的颜色 width:1, //线的宽度 type:‘solide‘//显得类型 }
},
//坐标轴 刻度 就是纵向多出来的小线 axisTick: {
show: true,
inside:false, //---是否朝内 lengt:3, //长度 lineStyle:{
//color:‘red‘, //---默认取轴线的颜色 width:1,
type:‘solid‘,
},
},
//坐标轴标签 坐标轴显示的数值 axisLabel: {
show:true, //---是否显示 inside:false, //---是否朝内 rotate:0, //---旋转角度 margin: 8, //---刻度标签与轴线之间的距离 textStyle: {
color: ‘#999‘
}
},
//--网格区域 splitArea:{
show:false, //---是否显示,默认false },
},
// 数据区域的缩放 dataZoom: [
{
type: ‘inside‘
}
],
//内容数据 series: [
{
// name:‘销量‘, //系列名称 跟图例相对应 也就是那个带颜色的小图标 type: ‘bar‘,
// 生成的一条柱子来产生阴影// itemStyle: {// color: ‘rgba(0,0,0,0.05)‘// },// barGap: ‘-100%‘,// barCategoryGap: ‘40%‘,// data: dataShadow,// animation: false },
{
type: ‘bar‘,
// 图形形状 itemStyle: {
color: new echarts.graphic.LinearGradient(
0, 0, 0, 1,
[
// 柱子0%的颜色 {offset: 0, color: ‘#01F4D4‘},
//柱子50%的颜色 {offset: 0.5, color: ‘#02E2E8‘},
//柱子100%的颜色 {offset: 1, color: ‘#02D2F9‘}
]
)
},
//鼠标放到柱子上的样式 emphasis: {
itemStyle: {
color: new echarts.graphic.LinearGradient(
0, 0, 0, 1,
[
{offset: 0, color: ‘#2378f7‘},
{offset: 0.7, color: ‘#2378f7‘},
{offset: 1, color: ‘#83bff6‘}
]
)
}
},
barWidth:‘30‘, //调节柱子的宽度 barCategoryGap:‘30%‘, //调节柱子之间的距离 data: [3020, 4800, 3600, 6050, 4320, 6200,5050]
}
]
};
// Enable data zoom when user click bar.var zoomSize =6;
myChart.on(‘click‘, function (params) {
console.log(dataAxis[Math.max(params.dataIndex - zoomSize /2, 0)]);
myChart.dispatchAction({
type: ‘dataZoom‘,
startValue: dataAxis[Math.max(params.dataIndex - zoomSize /2, 0)],
endValue: dataAxis[Math.min(params.dataIndex + zoomSize /2, data.length -1)]
});
});
//实例化显示图表myChart.setOption(option)
</script></html>
<!
DOCTYPE html
>
<
html
lang
="en"
>
<
head
>
<
meta
charset
="UTF-8"
>
<
meta
name
="viewport"
content
="width=device-width, initial-scale=1.0"
>
<
title
>Document</title><script src="./echarts.min.js"></script></head><body><div id="a" style="width: 500px; height: 500px;"></div></body><script>var myChart = echarts.init(document.getElementById(‘a‘))
option = {
tooltip: {
trigger: ‘axis‘,
axisPointer: { // 坐标轴指示器,坐标轴触发有效 type: ‘shadow‘// 默认为直线,可选为:‘line‘ | ‘shadow‘ }
},
legend: {
type:‘plain‘,
right:‘0%‘,
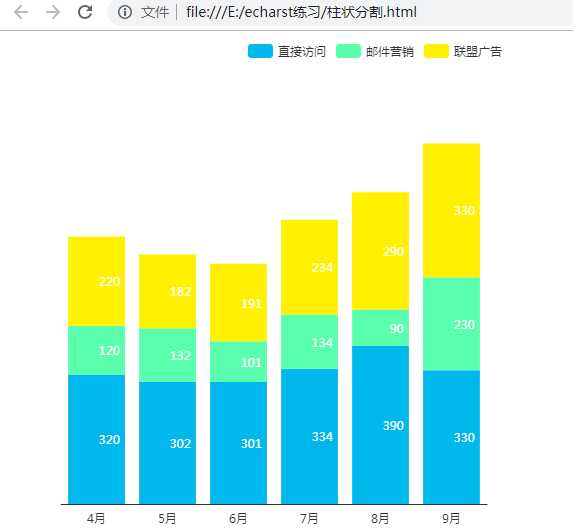
data: [‘直接访问‘, ‘邮件营销‘, ‘联盟广告‘],
},
grid: {
left: ‘3%‘,
right: ‘4%‘,
bottom: ‘3%‘,
containLabel: true
},
xAxis: {
type: ‘category‘,
data: [‘4月‘, ‘5月‘, ‘6月‘, ‘7月‘, ‘8月‘, ‘9月‘],
axisTick: {
show: false
},
},
yAxis: {
show:false,
type: ‘value‘,
},
series: [
{
name: ‘直接访问‘,
type: ‘bar‘,
stack: ‘总量‘,
label: {
show: true,
position: ‘insideRight‘
},
itemStyle: {
color: ‘#00B7EE‘,
},
data: [320, 302, 301, 334, 390, 330]
},
{
name: ‘邮件营销‘,
type: ‘bar‘,
stack: ‘总量‘,
label: {
show: true,
position: ‘insideRight‘
},
itemStyle: {
color: ‘#5AFFAE‘,
},
data: [120, 132, 101, 134, 90, 230]
},
{
name: ‘联盟广告‘,
type: ‘bar‘,
stack: ‘总量‘,
label: {
show: true,
position: ‘insideRight‘
},
itemStyle: {
color: ‘#fff100‘,
},
data: [220, 182, 191, 234, 290, 330]
},
]
};
myChart.setOption(option)
window.onresize=function(){
myChart.resize()
}
</script></html>
原文:https://www.cnblogs.com/sheep-fu/p/13563575.html
内容总结
以上是互联网集市为您收集整理的Echarts柱形图 实例全部内容,希望文章能够帮你解决Echarts柱形图 实例所遇到的程序开发问题。 如果觉得互联网集市技术教程内容还不错,欢迎将互联网集市网站推荐给程序员好友。
内容备注
版权声明:本文内容由互联网用户自发贡献,该文观点与技术仅代表作者本人。本站仅提供信息存储空间服务,不拥有所有权,不承担相关法律责任。如发现本站有涉嫌侵权/违法违规的内容, 请发送邮件至 gblab@vip.qq.com 举报,一经查实,本站将立刻删除。
内容手机端
扫描二维码推送至手机访问。
来源:【匿名】