纯JAVASCRIPT图表动画插件Highcharts Examples
内容导读
互联网集市收集整理的这篇技术教程文章主要介绍了纯JAVASCRIPT图表动画插件Highcharts Examples,小编现在分享给大家,供广大互联网技能从业者学习和参考。文章包含4311字,纯文字阅读大概需要7分钟。
内容图文
 What is Highcharts? 下载地址 //www.gxlcms.com/jiaoben/24363.html
Highcharts is a charting library written in pure JavaScript, offering an easy way of adding interactive charts to your web site or web application. Highcharts currently supports line, spline, area, areaspline, column, bar, pie and scatter chart types.
Features

It works in all modern browsers including the iPhone/iPad and Internet Explorer from version 6. Standard browsers use SVG for the graphics rendering. In Internet Explorer graphics are drawn using VML.

.
Highcharts is solely based on native browser technologies and doesn't require client side plugins like Flash or Java. Furthermore you don't need to install anything on your server. No PHP or ASP.NET. Highcharts needs only two JS files to run: The highcharts.js core and either the jQuery or the MooTools framework. One of these frameworks is most likely already in use in your web page.
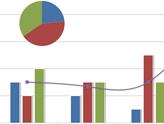
Highcharts supports line, spline, area, areaspline, column, bar, pie and scatter chart types. Any of these can be combined in one chart.
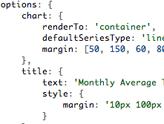
Setting the Highcharts configuration options requires no special programming skills. The options are given in a JavaScript object notation structure, which is basically a set of keys and values connected by colons, separated by commas and grouped by curly brackets.
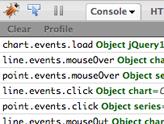
Through a full API you can add, remove and modify series, axes or points at any time after chart creation. Numerous events supply hooks for programming agains the chart. In combination with jQuery's or MooTools' Ajax API, this opens for solutions like live charts constantly updating with values from the server, user supplied data and more.
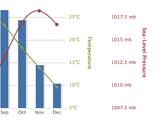
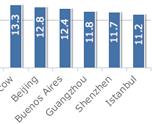
Sometimes you want to compare variables that are not the same scale - for example temperature versus rainfall and air pressure. Highcharts lets you assign an y axis for each series - or an x axis if you want to compare data sets of different categories. Each axis can be placed to the right or left, top or bottom of the chart. All options can be set individually, including reversing, styling and position.
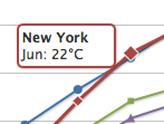
On hovering the chart Highcharts can display a tooltip text with information on each point and series. The tooltip follows as the user moves the mouse over the graph, and great efforts have been taken to make it stick to the nearest point as well as making it easy to read a point that is below another point.
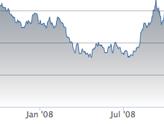
75% of all charts with an X and Y axis have a date-time X axis. Therefore Highchart is very intelligent about time values. With milliseconds axis units, Highcharts determines where to place the ticks so that they always mark the start of the month or the week, midnight and midday, the full hour etc.
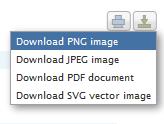
With the exporting module enabled, your users can export the chart to PNG, JPG, PDF or SVG format at the click of a button, or print the chart directly from the web page.
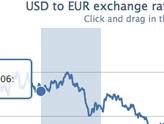
By zooming in on a chart you can examine an especially interesting part of the data more closely. Zooming can be in the X or Y dimension, or both.

Highcharts takes the data in a JavaScript array, which can be defined in the local configuration object, in a separate file or even on a different site. Furthermore, the data can be handled over to Highcharts in any form, and a callback function used to parse the data into an array.
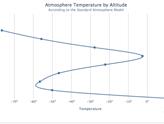
Sometimes you need to flip over your chart and make the X axis appear vertical, like for example in a bar chart. Reversing the axis, with the highest values appearing closest to origo, is also supported.
Do you want to use Highcharts for a personal website, a school site or a non-profit organisation? Then you don't need the author's permission, just go on and use Highcharts. For commercial websites and projects, see
内容总结
以上是互联网集市为您收集整理的纯JAVASCRIPT图表动画插件Highcharts Examples全部内容,希望文章能够帮你解决纯JAVASCRIPT图表动画插件Highcharts Examples所遇到的程序开发问题。 如果觉得互联网集市技术教程内容还不错,欢迎将互联网集市网站推荐给程序员好友。
内容备注
版权声明:本文内容由互联网用户自发贡献,该文观点与技术仅代表作者本人。本站仅提供信息存储空间服务,不拥有所有权,不承担相关法律责任。如发现本站有涉嫌侵权/违法违规的内容, 请发送邮件至 gblab@vip.qq.com 举报,一经查实,本站将立刻删除。
内容手机端
扫描二维码推送至手机访问。