Tracing Memory access of an oracle process : Intel PinTools
内容导读
互联网集市收集整理的这篇技术教程文章主要介绍了Tracing Memory access of an oracle process : Intel PinTools,小编现在分享给大家,供广大互联网技能从业者学习和参考。文章包含3410字,纯文字阅读大概需要5分钟。
内容图文

This blog post is motivated by a conversation with Frits Hoogland on his great blog post The curious case of the missing semctl call about how he managed to find a useful memory address (suspecting a fixed SGA variable) used by a process in his investigation.So here i will show how we can easily generates a trace of all/range of memory addresses referenced by a program with an acceptable overhead.
For that we are going to use a Binary Instrumentation Tool named Pin.Pin is basically a tool to insert arbitrary code (written in C or C++) in arbitrary places in the executable. The code is added dynamically while the executable is running.
What is interesting is that Pin allow as to us to instrument only a class of instructions like memory operations by using the Pin API which includes functions that classify and examine instructions.For more info please check :
- https://software.intel.com/en-us/articles/pin-a-dynamic-binary-instrumentation-tool
- https://software.intel.com/sites/landingpage/pintool/docs/76991/Pin/html/index.html#MAddressTrace
- https://software.intel.com/en-us/articles/pin-a-binary-instrumentation-tool-downloads
Using PinTools we can trace all/range of memory references inside a program by attaching to the running process.
Time for testing : (OEL6/UEK4/ORACLE 12.1.0.2.6)
- Download pin tools and install it as user oracle (as of UPDATE 17/11/2016 )
- Build the sample tool for memory reference tracing ( cd source/tools/SimpleExamples make obj-intel64/pinatrace.so )
- Test it using the root/oracle user :
../../../pin -t obj-intel64/pinatrace.so — /bin/ls
UPDATE 17/11/2016 : The owner of the instrumented program (target to attach to) need to access some files from the pin directory like (pinbin,linker,etc) so to trace the oracle executable (owner oracle) using the root user for example execute the following command after installing pin :”chown -R oracle pin_tools/pin-3.0-76991-gcc-linux” or simply install pin using the oracle user (if the instrumented program don’t have access to some files in the pin directory you will receive the following misleading error “E: Pin loader can’t open file /app/oracle/12.1.0/dbhome_1/bin/oracle: Permission denied”).
UPDATE 17/11/2016 : Good introduction to Intel Pin by Frits Hoogland : Introduction to Intel Pin
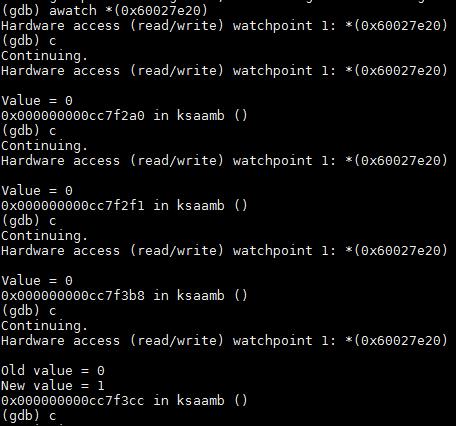
Let’s try how we can find the address “0x60027e20” referenced inside “ksaamb” using PIN tools.(as found by Frits Hoogland) .
Using gdb we can verify that with our test case (deleting one line from a table followed by a commit) this address is accessed 4 time (3 reads/1 writes):
Using pin tools (The test case took less that 2 sec to run and display all the memory address referenced) :
/pin-3.0-76991-gcc-linux/pin -pid 9266 -t /pin-3.0-76991-gcc-linux/source/tools/SimpleExamples/obj-intel64/pinatrace.so

We have the memory address and it’s content and also from where it’s was referenced (Instruction pointer). Using addr2line we can display the actual symbol name :

Extract from the memory trace file :

This was a very simple example using a ready to use sample tools.More complex plugin can be written depending on the needs.
Tracing Memory access of an oracle process : Intel PinTools
标签:aam files ati tin div rsa tor ali lan
本文系统来源:https://www.cnblogs.com/zengkefu/p/8432176.html
内容总结
以上是互联网集市为您收集整理的Tracing Memory access of an oracle process : Intel PinTools全部内容,希望文章能够帮你解决Tracing Memory access of an oracle process : Intel PinTools所遇到的程序开发问题。 如果觉得互联网集市技术教程内容还不错,欢迎将互联网集市网站推荐给程序员好友。
内容备注
版权声明:本文内容由互联网用户自发贡献,该文观点与技术仅代表作者本人。本站仅提供信息存储空间服务,不拥有所有权,不承担相关法律责任。如发现本站有涉嫌侵权/违法违规的内容, 请发送邮件至 gblab@vip.qq.com 举报,一经查实,本站将立刻删除。
内容手机端
扫描二维码推送至手机访问。