javascript权威指南:一个javascript贷款计算器
内容导读
互联网集市收集整理的这篇技术教程文章主要介绍了javascript权威指南:一个javascript贷款计算器,小编现在分享给大家,供广大互联网技能从业者学习和参考。文章包含11924字,纯文字阅读大概需要18分钟。
内容图文

文章目录
<!DOCTYPE html>
<html>
<head>
<title>JavaScript Loan Calculator</title>
<style> /* This is a CSS style sheet: it adds style to the program output */
.output { font-weight: bold; } /* Calculated values in bold */
#payment { text-decoration: underline; } /* For element with id="payment" */
#graph { border: solid black 1px; } /* Chart has a simple border */
th, td { vertical-align: top; } /* Don't center table cells */
</style>
</head>
<body>
<!--
This is an HTML table with <input> elements that allow the user to enter data
and <span> elements in which the program can display its results.
These elements have ids like "interest" and "years". These ids are used
in the JavaScript code that follows the table. Note that some of the input
elements define "onchange" or "onclick" event handlers. These specify strings
of JavaScript code to be executed when the user enters data or clicks.
-->
<table>
<tr><th>Enter Loan Data:</th>
<td></td>
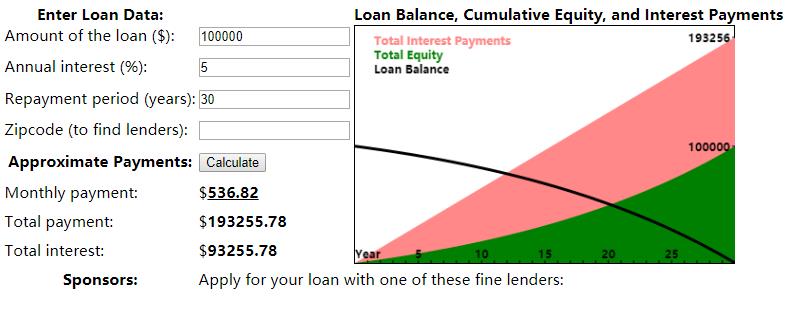
<th>Loan Balance, Cumulative Equity, and Interest Payments</th></tr>
<tr><td>Amount of the loan ($):</td>
<td><input id="amount" onchange="calculate();"></td>
<td rowspan=8>
<canvas id="graph" width="400" height="250"></canvas></td></tr>
<tr><td>Annual interest (%):</td>
<td><input id="apr" onchange="calculate();"></td></tr>
<tr><td>Repayment period (years):</td>
<td><input id="years" onchange="calculate();"></td>
<tr><td>Zipcode (to find lenders):</td>
<td><input id="zipcode" onchange="calculate();"></td>
<tr><th>Approximate Payments:</th>
<td><button onclick="calculate();">Calculate</button></td></tr>
<tr><td>Monthly payment:</td>
<td>$<span class="output" id="payment"></span></td></tr>
<tr><td>Total payment:</td>
<td>$<span class="output" id="total"></span></td></tr>
<tr><td>Total interest:</td>
<td>$<span class="output" id="totalinterest"></span></td></tr>
<tr><th>Sponsors:</th><td colspan=2>
Apply for your loan with one of these fine lenders:
<div id="lenders"></div></td></tr>
</table>
<!-- The rest of this example is JavaScript code in the <script> tag below -->
<!-- Normally, this script would go in the document <head> above but it -->
<!-- is easier to understand here, after you've seen its HTML context. -->
<script>
"use strict"; // Use ECMAScript 5 strict mode in browsers that support it
/*
* This script defines the calculate() function called by the event handlers
* in HTML above. The function reads values from <input> elements, calculates
* loan payment information, displays the results in <span> elements. It also
* saves the user's data, displays links to lenders, and draws a chart.
*/
function calculate() {
// Look up the input and output elements in the document
var amount = document.getElementById("amount");
var apr = document.getElementById("apr");
var years = document.getElementById("years");
var zipcode = document.getElementById("zipcode");
var payment = document.getElementById("payment");
var total = document.getElementById("total");
var totalinterest = document.getElementById("totalinterest");
// Get the user's input from the input elements. Assume it is all valid.
// Convert interest from a percentage to a decimal, and convert from
// an annual rate to a monthly rate. Convert payment period in years
// to the number of monthly payments.
var principal = parseFloat(amount.value);
var interest = parseFloat(apr.value) / 100 / 12;
var payments = parseFloat(years.value) * 12;
// Now compute the monthly payment figure.
var x = Math.pow(1 + interest, payments); // Math.pow() computes powers
var monthly = (principal*x*interest)/(x-1);
// If the result is a finite number, the user's input was good and
// we have meaningful results to display
if (isFinite(monthly)) {
// Fill in the output fields, rounding to 2 decimal places
payment.innerHTML = monthly.toFixed(2);
total.innerHTML = (monthly * payments).toFixed(2);
totalinterest.innerHTML = ((monthly*payments)-principal).toFixed(2);
// Save the user's input so we can restore it the next time they visit
save(amount.value, apr.value, years.value, zipcode.value);
// Advertise: find and display local lenders, but ignore network errors
try { // Catch any errors that occur within these curly braces
getLenders(amount.value, apr.value, years.value, zipcode.value);
}
catch(e) { /* And ignore those errors */ }
// Finally, chart loan balance, and interest and equity payments
chart(principal, interest, monthly, payments);
}
else {
// Result was Not-a-Number or infinite, which means the input was
// incomplete or invalid. Clear any previously displayed output.
payment.innerHTML = ""; // Erase the content of these elements
total.innerHTML = ""
totalinterest.innerHTML = "";
chart(); // With no arguments, clears the chart
}
}
// Save the user's input as properties of the localStorage object. Those
// properties will still be there when the user visits in the future
// This storage feature will not work in some browsers (Firefox, e.g.) if you
// run the example from a local file:// URL. It does work over HTTP, however.
function save(amount, apr, years, zipcode) {
if (window.localStorage) { // Only do this if the browser supports it
localStorage.loan_amount = amount;
localStorage.loan_apr = apr;
localStorage.loan_years = years;
localStorage.loan_zipcode = zipcode;
}
}
// Automatically attempt to restore input fields when the document first loads.
window.onload = function() {
// If the browser supports localStorage and we have some stored data
if (window.localStorage && localStorage.loan_amount) {
document.getElementById("amount").value = localStorage.loan_amount;
document.getElementById("apr").value = localStorage.loan_apr;
document.getElementById("years").value = localStorage.loan_years;
document.getElementById("zipcode").value = localStorage.loan_zipcode;
}
};
// Pass the user's input to a server-side script which can (in theory) return
// a list of links to local lenders interested in making loans. This example
// does not actually include a working implementation of such a lender-finding
// service. But if the service existed, this function would work with it.
function getLenders(amount, apr, years, zipcode) {
// If the browser does not support the XMLHttpRequest object, do nothing
if (!window.XMLHttpRequest) return;
// Find the element to display the list of lenders in
var ad = document.getElementById("lenders");
if (!ad) return; // Quit if no spot for output
// Encode the user's input as query parameters in a URL
var url = "getLenders.php" + // Service url plus
"?amt=" + encodeURIComponent(amount) + // user data in query string
"&apr=" + encodeURIComponent(apr) +
"&yrs=" + encodeURIComponent(years) +
"&zip=" + encodeURIComponent(zipcode);
// Fetch the contents of that URL using the XMLHttpRequest object
var req = new XMLHttpRequest(); // Begin a new request
req.open("GET", url); // An HTTP GET request for the url
req.send(null); // Send the request with no body
// Before returning, register an event handler function that will be called
// at some later time when the HTTP server's response arrives. This kind of
// asynchronous programming is very common in client-side JavaScript.
req.onreadystatechange = function() {
if (req.readyState == 4 && req.status == 200) {
// If we get here, we got a complete valid HTTP response
var response = req.responseText; // HTTP response as a string
var lenders = JSON.parse(response); // Parse it to a JS array
// Convert the array of lender objects to a string of HTML
var list = "";
for(var i = 0; i < lenders.length; i++) {
list += "<li><a href='" + lenders[i].url + "'>" +
lenders[i].name + "</a>";
}
// Display the HTML in the element from above.
ad.innerHTML = "<ul>" + list + "</ul>";
}
}
}
// Chart monthly loan balance, interest and equity in an HTML <canvas> element.
// If called with no arguments then just erase any previously drawn chart.
function chart(principal, interest, monthly, payments) {
var graph = document.getElementById("graph"); // Get the <canvas> tag
graph.width = graph.width; // Magic to clear and reset the canvas element
// If we're called with no arguments, or if this browser does not support
// graphics in a <canvas> element, then just return now.
if (arguments.length == 0 || !graph.getContext) return;
// Get the "context" object for the <canvas> that defines the drawing API
var g = graph.getContext("2d"); // All drawing is done with this object
var width = graph.width, height = graph.height; // Get canvas size
// These functions convert payment numbers and dollar amounts to pixels
function paymentToX(n) { return n * width/payments; }
function amountToY(a) { return height-(a * height/(monthly*payments*1.05));}
// Payments are a straight line from (0,0) to (payments, monthly*payments)
g.moveTo(paymentToX(0), amountToY(0)); // Start at lower left
g.lineTo(paymentToX(payments), // Draw to upper right
amountToY(monthly*payments));
g.lineTo(paymentToX(payments), amountToY(0)); // Down to lower right
g.closePath(); // And back to start
g.fillStyle = "#f88"; // Light red
g.fill(); // Fill the triangle
g.font = "bold 12px sans-serif"; // Define a font
g.fillText("Total Interest Payments", 20,20); // Draw text in legend
// Cumulative equity is non-linear and trickier to chart
var equity = 0;
g.beginPath(); // Begin a new shape
g.moveTo(paymentToX(0), amountToY(0)); // starting at lower-left
for(var p = 1; p <= payments; p++) {
// For each payment, figure out how much is interest
var thisMonthsInterest = (principal-equity)*interest;
equity += (monthly - thisMonthsInterest); // The rest goes to equity
g.lineTo(paymentToX(p),amountToY(equity)); // Line to this point
}
g.lineTo(paymentToX(payments), amountToY(0)); // Line back to X axis
g.closePath(); // And back to start point
g.fillStyle = "green"; // Now use green paint
g.fill(); // And fill area under curve
g.fillText("Total Equity", 20,35); // Label it in green
// Loop again, as above, but chart loan balance as a thick black line
var bal = principal;
g.beginPath();
g.moveTo(paymentToX(0),amountToY(bal));
for(var p = 1; p <= payments; p++) {
var thisMonthsInterest = bal*interest;
bal -= (monthly - thisMonthsInterest); // The rest goes to equity
g.lineTo(paymentToX(p),amountToY(bal)); // Draw line to this point
}
g.lineWidth = 3; // Use a thick line
g.stroke(); // Draw the balance curve
g.fillStyle = "black"; // Switch to black text
g.fillText("Loan Balance", 20,50); // Legend entry
// Now make yearly tick marks and year numbers on X axis
g.textAlign="center"; // Center text over ticks
var y = amountToY(0); // Y coordinate of X axis
for(var year=1; year*12 <= payments; year++) { // For each year
var x = paymentToX(year*12); // Compute tick position
g.fillRect(x-0.5,y-3,1,3); // Draw the tick
if (year == 1) g.fillText("Year", x, y-5); // Label the axis
if (year % 5 == 0 && year*12 !== payments) // Number every 5 years
g.fillText(String(year), x, y-5);
}
// Mark payment amounts along the right edge
g.textAlign = "right"; // Right-justify text
g.textBaseline = "middle"; // Center it vertically
var ticks = [monthly*payments, principal]; // The two points we'll mark
var rightEdge = paymentToX(payments); // X coordinate of Y axis
for(var i = 0; i < ticks.length; i++) { // For each of the 2 points
var y = amountToY(ticks[i]); // Compute Y position of tick
g.fillRect(rightEdge-3, y-0.5, 3,1); // Draw the tick mark
g.fillText(String(ticks[i].toFixed(0)), // And label it.
rightEdge-5, y);
}
}
</script>
</body>
</html>
内容总结
以上是互联网集市为您收集整理的javascript权威指南:一个javascript贷款计算器全部内容,希望文章能够帮你解决javascript权威指南:一个javascript贷款计算器所遇到的程序开发问题。 如果觉得互联网集市技术教程内容还不错,欢迎将互联网集市网站推荐给程序员好友。
内容备注
版权声明:本文内容由互联网用户自发贡献,该文观点与技术仅代表作者本人。本站仅提供信息存储空间服务,不拥有所有权,不承担相关法律责任。如发现本站有涉嫌侵权/违法违规的内容, 请发送邮件至 gblab@vip.qq.com 举报,一经查实,本站将立刻删除。
内容手机端
扫描二维码推送至手机访问。
来源:【匿名】