JavaScript Source Code映射引起的一个SAP C4C代码调试问题
内容导读
互联网集市收集整理的这篇技术教程文章主要介绍了JavaScript Source Code映射引起的一个SAP C4C代码调试问题,小编现在分享给大家,供广大互联网技能从业者学习和参考。文章包含3032字,纯文字阅读大概需要5分钟。
内容图文

I was bothered by this question recently and didn’t find an answer to it for a long time till today.
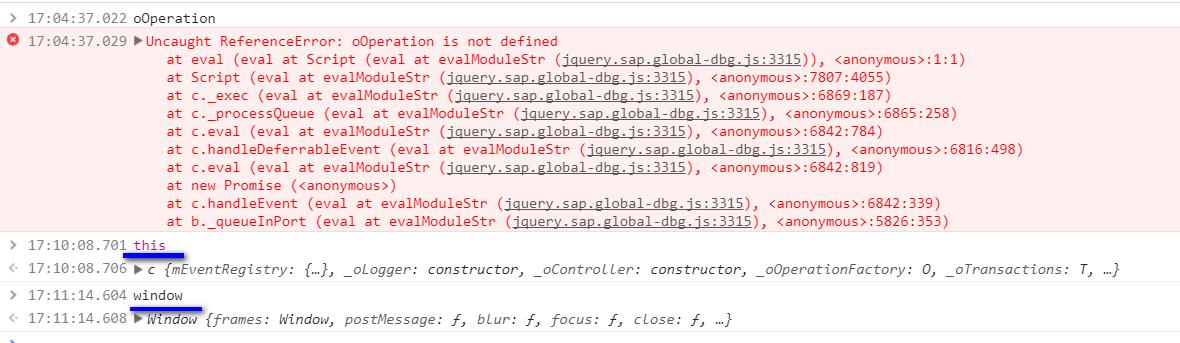
The issue is, in Chrome debugger when I hover the mouse on top of a given variable which is defined within a JavaScript function, I could successfully see the content of it.
Meanwhile the variable content could also automatically be displayed in Chrome, see highlight marked with red below – so far so good.
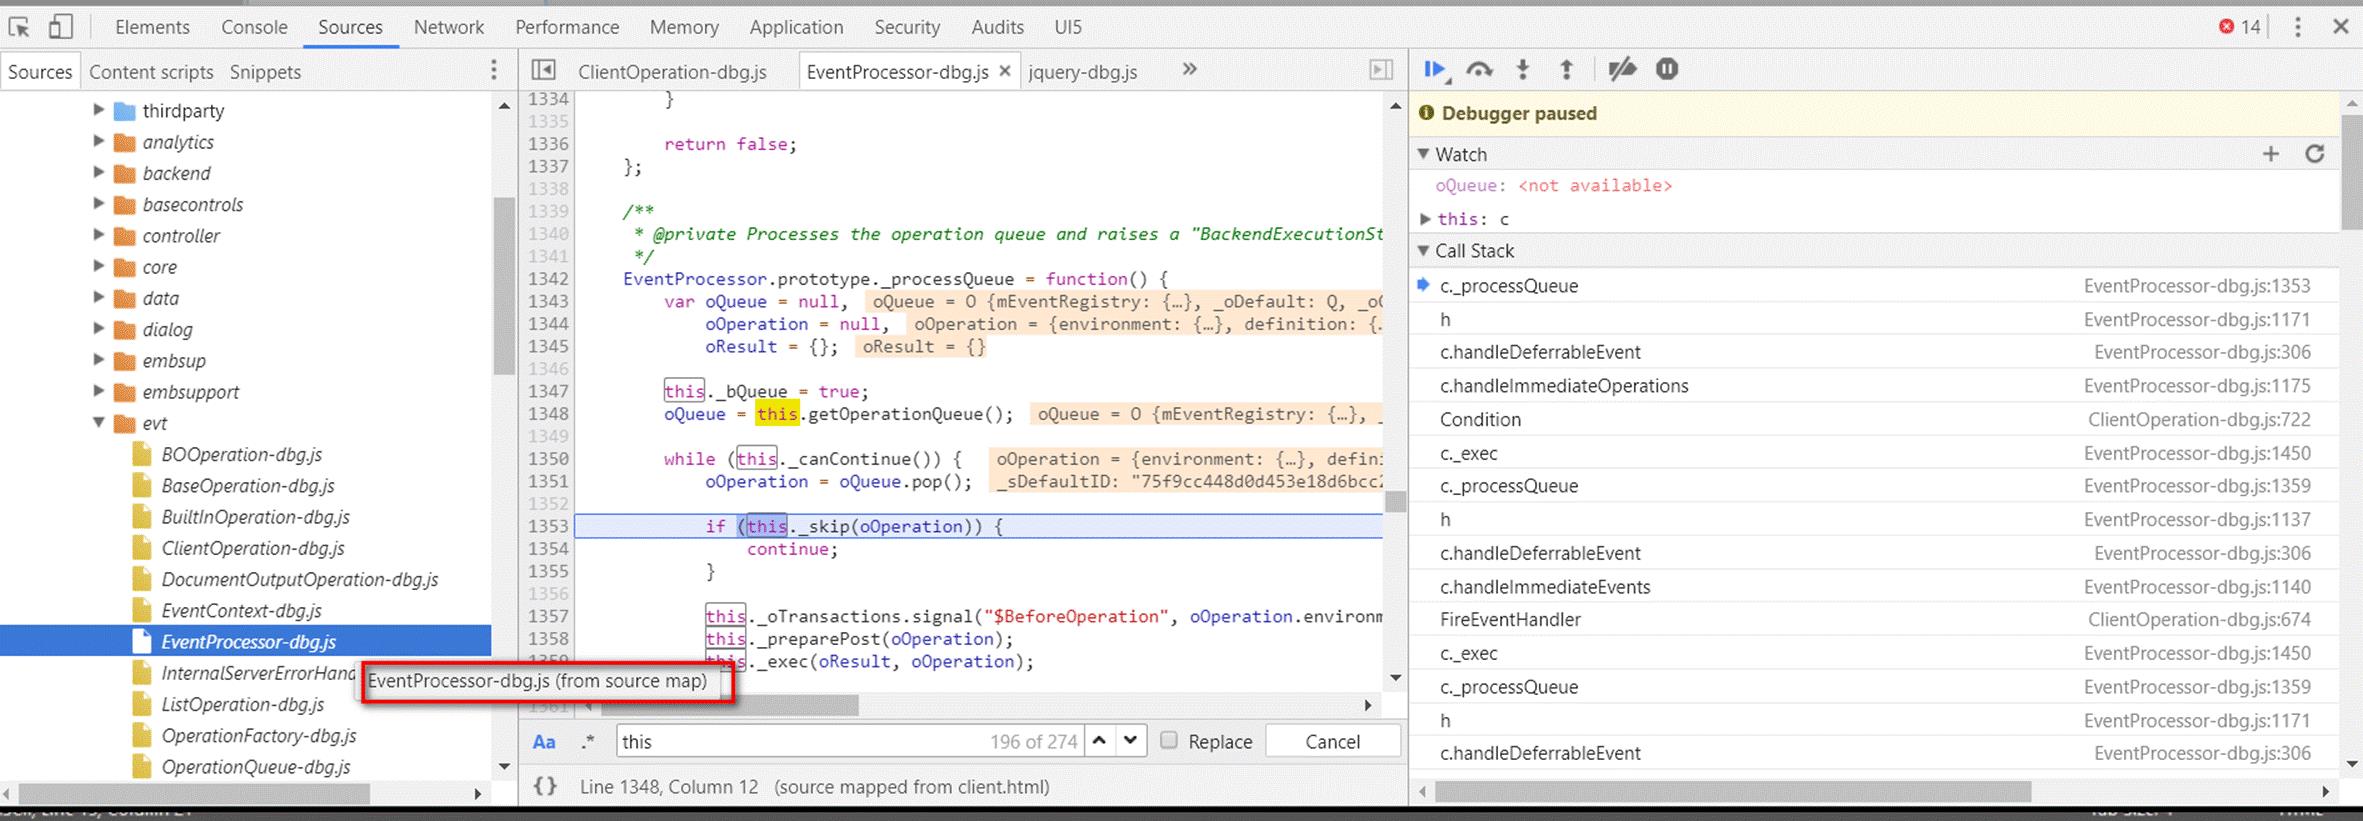
However, when I manually type the variable oOperation under “Watch” tab and to my surprise, the variable content fails to display there. See below highlighted with blue.
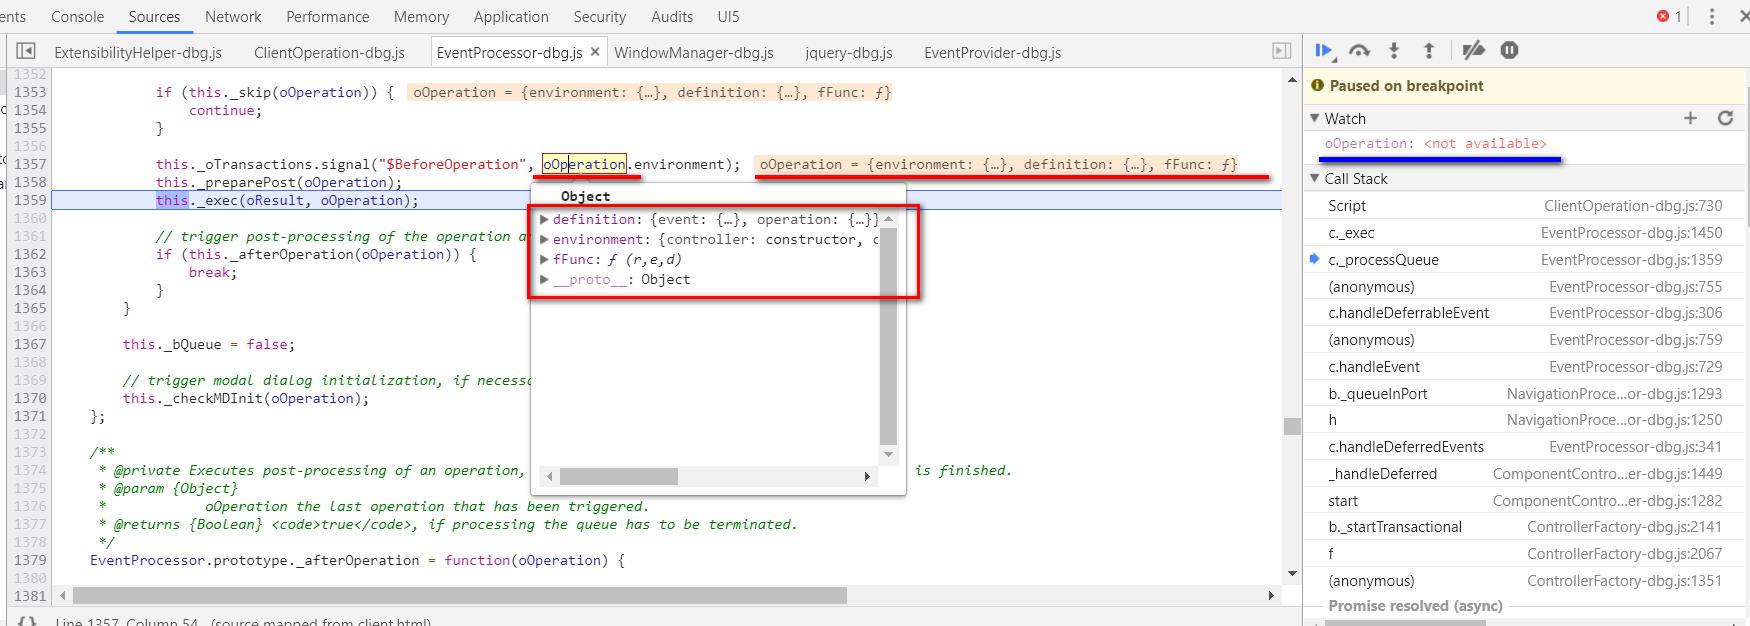
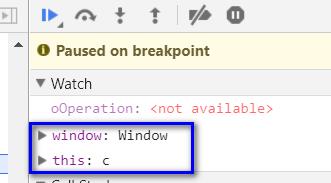
However the display works for “window” and “this”.
I tried in Chrome: although oOperation appears in auto completion list as I expected,
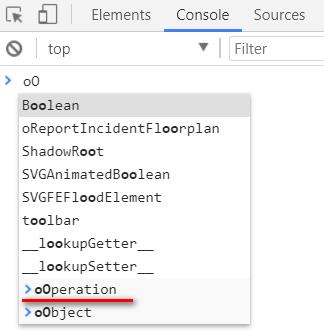
Once I choose it and type enter key, still it fails to display again:
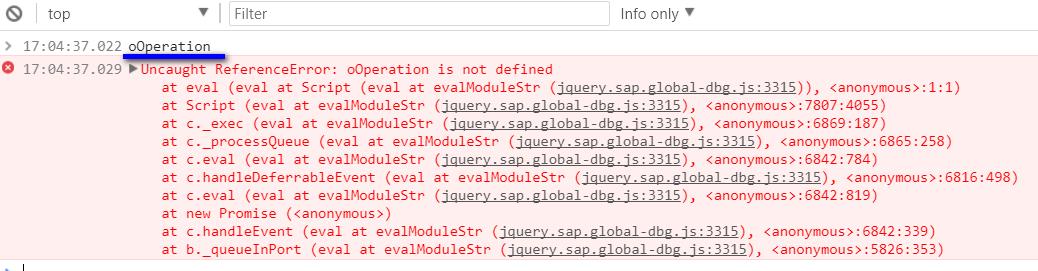
And “this” and “window” could still be displayed well in console.
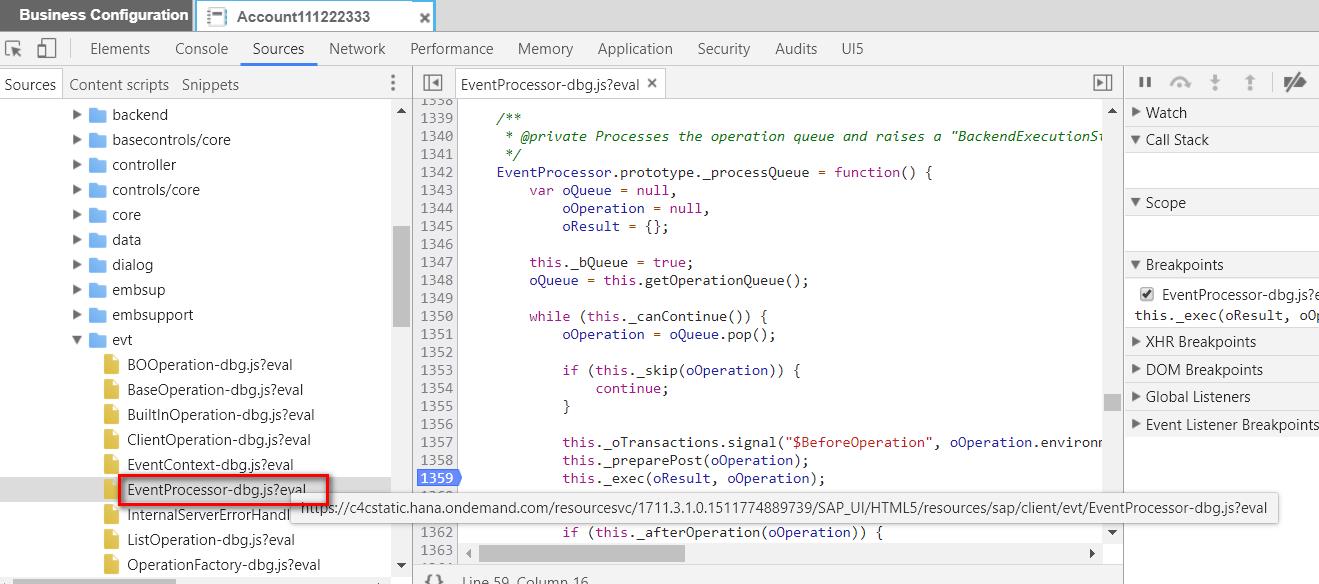
After some research finally I figured it out: although it seems I am working on the javascript file with debugging version EventProcessor-dbg.js, but actually it is not.
Pay attention to the folder with orange color below and the tooltip “from source map”.

Source code map mechanism is a good friend for we developers, as it enables to display the content of original JavaScript file ( debugging version ) based on the files of released version ( usually minified and uglified ) used in productive environment.
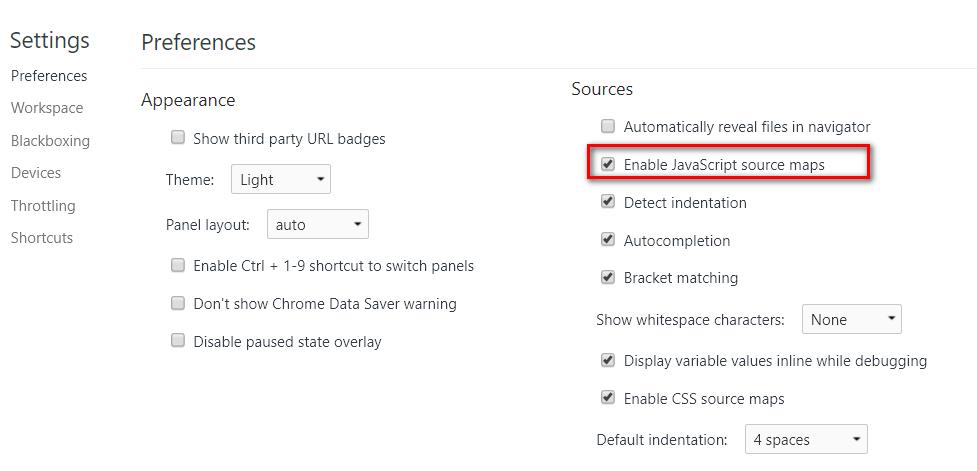
By default it is enabled via settings in Chrome development tool here:
Perform a global search in Chrome development tool using keyword “sourceMappingURL” and you can find some .map files:
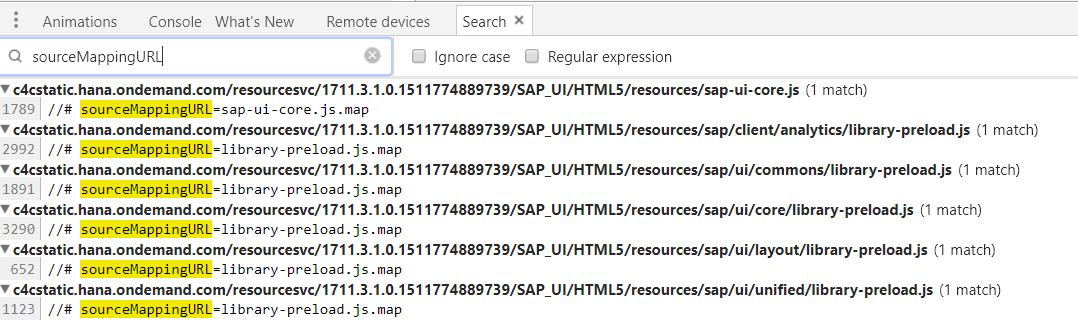
The purpose of the map files is to allow the browser to display the original sources instead of the name-mangled and merged bundle files (like sap-ui-core.js, library-preload.js or Component-preload.js in UI5). To make this possible, sourcemap files basically contain a mapping from text fragments in the bundle to the corresponding fragments in the source file(s). – from codeworrior mentioned in OpenUI5 github issue https://github.com/SAP/openui5/issues/1611
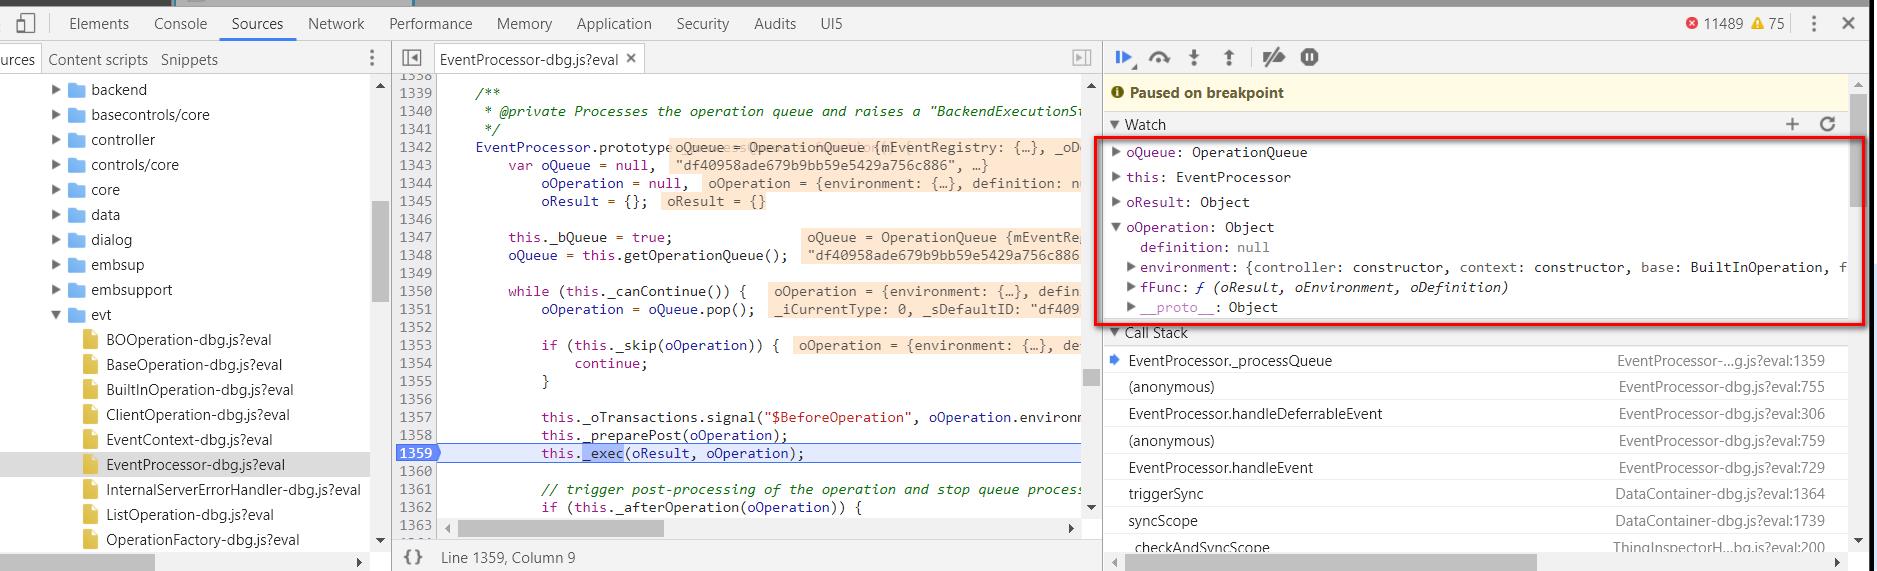
So After I load the real debugging version file with sap-ui-debug=true, the folder color turns normal ( blue color ):
Just compare the orange color for source code map below:
When I am manipulating the real debugging version, I could now use the original variable name in Watch area as well, however at the cost of the long waiting time to load the original file.
Just compare the performance when C4C HTML5 UI successfully renders the first Work center, Customer, configured by default using Source Code map and sap-ui-debug=true:
The following screenshot is the time consumed using source code map:

The following is for sap-ui-debug=true, where significant performance difference are observed.

So in most of cases, it is just enough for we developers to leverage source code map to finish our debugging task instead of really loading .dbg files.
If you have already reached here, you might be also interested with More detail about UI5 Source code map mechanism.
要获取更多Jerry的原创文章,请关注公众号"汪子熙":
内容总结
以上是互联网集市为您收集整理的JavaScript Source Code映射引起的一个SAP C4C代码调试问题全部内容,希望文章能够帮你解决JavaScript Source Code映射引起的一个SAP C4C代码调试问题所遇到的程序开发问题。 如果觉得互联网集市技术教程内容还不错,欢迎将互联网集市网站推荐给程序员好友。
内容备注
版权声明:本文内容由互联网用户自发贡献,该文观点与技术仅代表作者本人。本站仅提供信息存储空间服务,不拥有所有权,不承担相关法律责任。如发现本站有涉嫌侵权/违法违规的内容, 请发送邮件至 gblab@vip.qq.com 举报,一经查实,本站将立刻删除。
内容手机端
扫描二维码推送至手机访问。