TensorFlow activatefunction 和可视化(3)
内容导读
互联网集市收集整理的这篇技术教程文章主要介绍了TensorFlow activatefunction 和可视化(3),小编现在分享给大家,供广大互联网技能从业者学习和参考。文章包含2511字,纯文字阅读大概需要4分钟。
内容图文
")
#
View more python learning tutorial on my Youtube and Youku channel!!!
#
Youtube video tutorial: https://www.youtube.com/channel/UCdyjiB5H8Pu7aDTNVXTTpcg
#
Youku video tutorial: http://i.youku.com/pythontutorial
"""
Please note, this code is only for python 3+. If you are using python 2+, please modify the code accordingly.
"""
from
__future__
import
print_function
import
tensorflow as tf
import
numpy as np
def add_layer(inputs, in_size, out_size, n_layer, activation_function=None):
# add one more layer and return the output of this layer
layer_name = ‘layer%s‘ % n_layer
with tf.name_scope(layer_name):
with tf.name_scope(‘weights‘):
Weights = tf.Variable(tf.random_normal([in_size, out_size]), name=‘W‘)
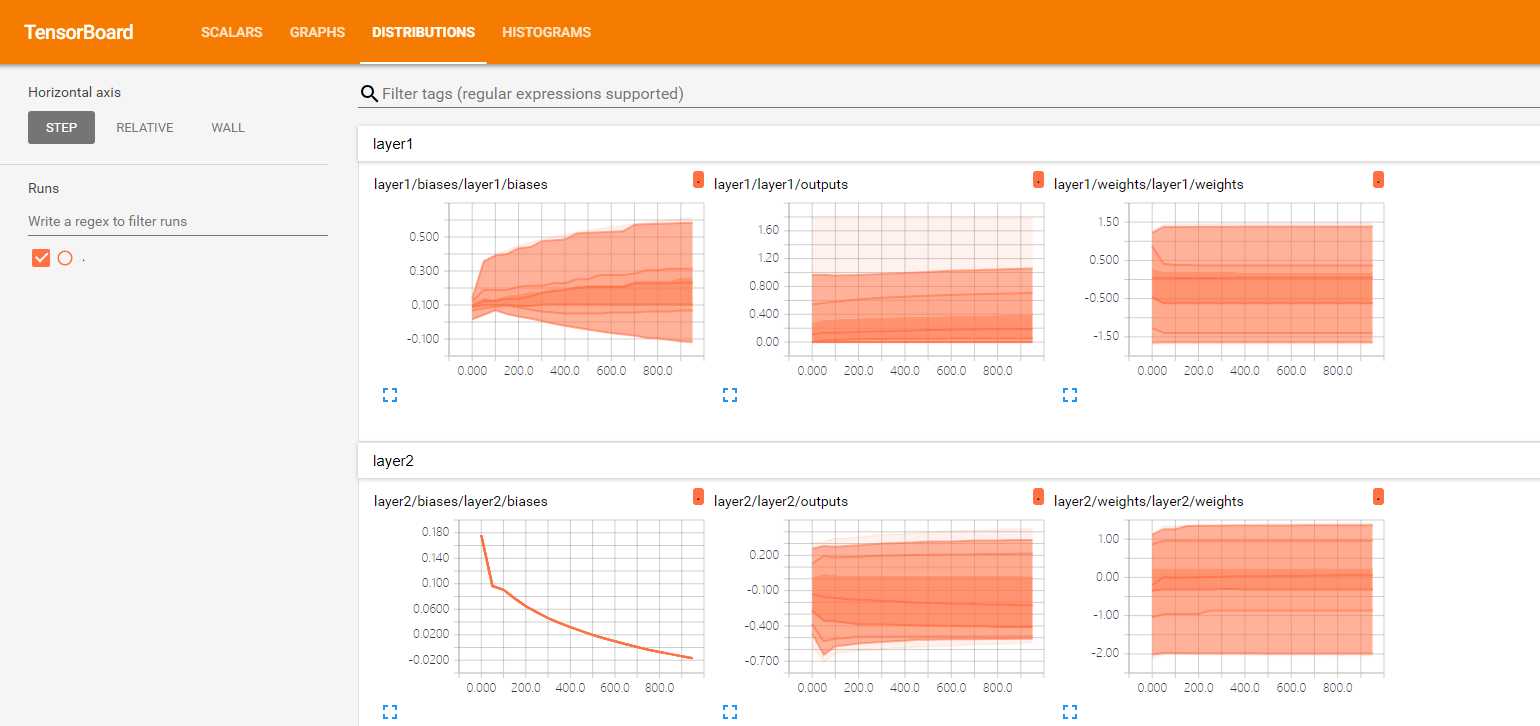
tf.summary.histogram(layer_name + ‘/weights‘, Weights)
with tf.name_scope(‘biases‘):
biases = tf.Variable(tf.zeros([1, out_size]) + 0.1, name=‘b‘)
tf.summary.histogram(layer_name + ‘/biases‘, biases)
with tf.name_scope(‘Wx_plus_b‘):
Wx_plus_b = tf.add(tf.matmul(inputs, Weights), biases)
if activation_function is None:
outputs = Wx_plus_b
else:
outputs = activation_function(Wx_plus_b, )
tf.summary.histogram(layer_name + ‘/outputs‘, outputs)
return outputs
# Make up some real data
x_data = np.linspace(-1, 1, 300)[:, np.newaxis]
noise = np.random.normal(0, 0.05, x_data.shape)
y_data = np.square(x_data) - 0.5 + noise
# define placeholder for inputs to network
with tf.name_scope(‘inputs‘):
xs = tf.placeholder(tf.float32, [None, 1], name=‘x_input‘)
ys = tf.placeholder(tf.float32, [None, 1], name=‘y_input‘)
# add hidden layer
l1 = add_layer(xs, 1, 10, n_layer=1, activation_function=tf.nn.relu)
# add output layer
prediction = add_layer(l1, 10, 1, n_layer=2, activation_function=None)
# the error between prediciton and real data
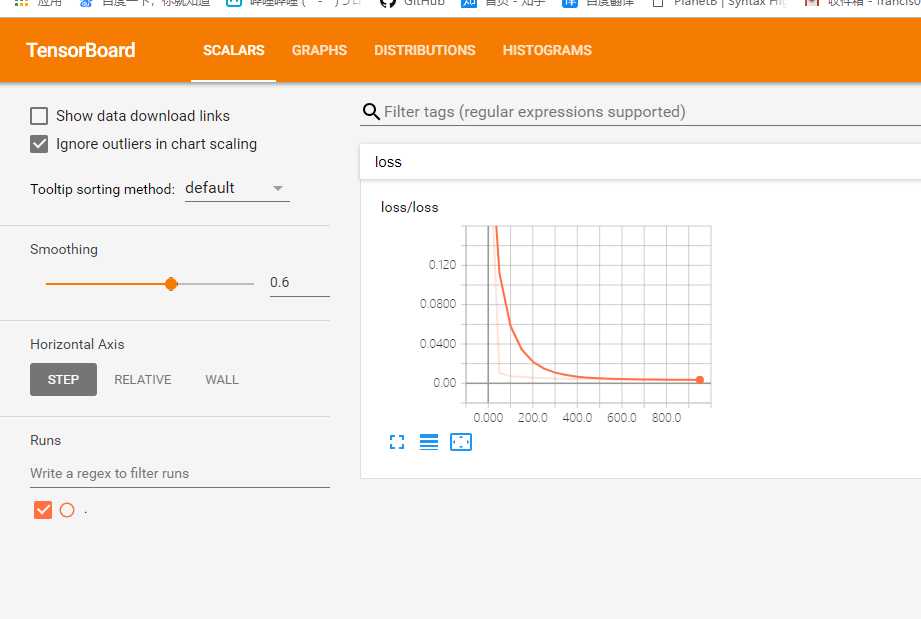
with tf.name_scope(‘loss‘):
loss = tf.reduce_mean(tf.reduce_sum(tf.square(ys - prediction),
reduction_indices=[1]))
tf.summary.scalar(‘loss‘, loss)
with tf.name_scope(‘train‘):
train_step = tf.train.GradientDescentOptimizer(0.1).minimize(loss)
sess = tf.Session()
merged = tf.summary.merge_all()
writer = tf.summary.FileWriter("logs/", sess.graph)
init = tf.global_variables_initializer()
sess.run(init)
for i in range(1000):
sess.run(train_step, feed_dict={xs: x_data, ys: y_data})
if i % 50 == 0:
result = sess.run(merged,
feed_dict={xs: x_data, ys: y_data})
writer.add_summary(result, i)
# direct to the local dir and run this in terminal:
# $ tensorboard --logdir logs


原文:https://www.cnblogs.com/francischeng/p/9693082.html
内容总结
以上是互联网集市为您收集整理的TensorFlow activatefunction 和可视化(3)全部内容,希望文章能够帮你解决TensorFlow activatefunction 和可视化(3)所遇到的程序开发问题。 如果觉得互联网集市技术教程内容还不错,欢迎将互联网集市网站推荐给程序员好友。
内容备注
版权声明:本文内容由互联网用户自发贡献,该文观点与技术仅代表作者本人。本站仅提供信息存储空间服务,不拥有所有权,不承担相关法律责任。如发现本站有涉嫌侵权/违法违规的内容, 请发送邮件至 gblab@vip.qq.com 举报,一经查实,本站将立刻删除。
内容手机端
扫描二维码推送至手机访问。
来源:【匿名】