matplotlib subplot 绘制多张图
内容导读
互联网集市收集整理的这篇技术教程文章主要介绍了matplotlib subplot 绘制多张图,小编现在分享给大家,供广大互联网技能从业者学习和参考。文章包含1477字,纯文字阅读大概需要3分钟。
内容图文

        def draw_images_grid_with_labels(data, nrows, figsize=(12, 12), **subplots_adjust_param):
    import matplotlib.pyplot as plt

#     fig, axes = plt.subplots(nrows, len(data) // nrows)
#     for idx, item in enumerate(data):
#         i = idx % nrows # Get subplot row
#         j = idx // nrows # Get subplot column
# #         print(data[idx][0][0].shape)
#         img = data[idx][0][0].permute(1, 2, 0)
#         label = data[idx][1]
#         axes[i, j].imshow(img)
#         axes[i, j].set_title(label)
#     plt.subplots_adjust(wspace=0, hspace=0)
# #     plt.tight_layout()
#     plt.show()

    _, axes = plt.subplots(nrows, len(data) // nrows, figsize=figsize)
    axes = axes.flatten()
    for idx, (img, axe) in enumerate(zip(data, axes)):
        img = data[idx][0][0].permute(1, 2, 0)
        label = data[idx][1]
        axe.imshow(img)
        axe.set_title(label)

    plt.subplots_adjust(**subplots_adjust_param)
#     plt.subplot_tool()
    plt.show()
params = {
"left": 0.125, # the left side of the subplots of the figure
"right": 0.9, # the right side of the subplots of the figure
"bottom": 0, # the bottom of the subplots of the figure
"top": 0.3, # the top of the subplots of the figure
"wspace": 0.3, # the amount of width reserved for space between subplots,
# expressed as a fraction of the average axis width
"hspace": 0.3, # the amount of height reserved for space between subplots,
# expressed as a fraction of the average axis height
}
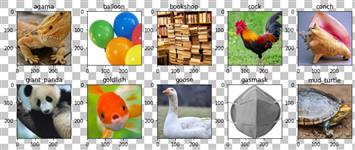
draw_images_grid_with_labels(res, 2, **params)
需要根据需求调整 params,实例如下
原文:https://www.cnblogs.com/konosubaakua/p/14687936.html
内容总结
以上是互联网集市为您收集整理的matplotlib subplot 绘制多张图全部内容,希望文章能够帮你解决matplotlib subplot 绘制多张图所遇到的程序开发问题。 如果觉得互联网集市技术教程内容还不错,欢迎将互联网集市网站推荐给程序员好友。
内容备注
版权声明:本文内容由互联网用户自发贡献,该文观点与技术仅代表作者本人。本站仅提供信息存储空间服务,不拥有所有权,不承担相关法律责任。如发现本站有涉嫌侵权/违法违规的内容, 请发送邮件至 gblab@vip.qq.com 举报,一经查实,本站将立刻删除。
内容手机端
扫描二维码推送至手机访问。
来源:【匿名】