python 图像处理(8):直方图与均衡化
内容导读
互联网集市收集整理的这篇技术教程文章主要介绍了python 图像处理(8):直方图与均衡化,小编现在分享给大家,供广大互联网技能从业者学习和参考。文章包含3156字,纯文字阅读大概需要5分钟。
内容图文
:直方图与均衡化")
在图像处理中,直方图是非常重要,也是非常有用的一个处理要素。
在skimage库中对直方图的处理,是放在exposure这个模块中。
1、计算直方图
函数:skimage.exposure.histogram(image, nbins=256)
在numpy包中,也提供了一个计算直方图的函数histogram(),两者大同小义。
返回一个tuple(hist, bins_center), 前一个数组是直方图的统计量,后一个数组是每个bin的中间值
import numpy as np
from skimage import exposure,data
image =data.camera()*1.0
hist1=np.histogram(image, bins=2)   #用numpy包计算直方图
hist2=exposure.histogram(image, nbins=2)  #用skimage计算直方图
print(hist1)
print(hist2)
输出:
(array([107432, 154712], dtype=int64), array([ 0. , 127.5, 255. ]))
(array([107432, 154712], dtype=int64), array([ 63.75, 191.25]))
分成两个bin,每个bin的统计量是一样的,但numpy返回的是每个bin的两端的范围值,而skimage返回的是每个bin的中间值
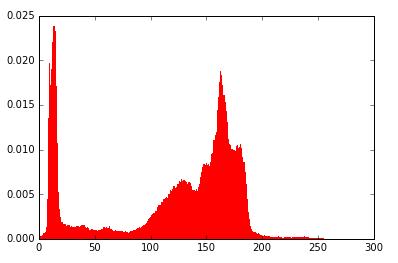
2、绘制直方图
绘图都可以调用matplotlib.pyplot库来进行,其中的hist函数可以直接绘制直方图。
调用方式:
n, bins, patches = plt.hist(arr, bins=10, normed=0, facecolor='black', edgecolor='black',alpha=1,histtype='bar')
hist的参数非常多,但常用的就这六个,只有第一个是必须的,后面四个可选
arr: 需要计算直方图的一维数组
bins: 直方图的柱数,可选项,默认为10
normed: 是否将得到的直方图向量归一化。默认为0
facecolor: 直方图颜色
edgecolor: 直方图边框颜色
alpha: 透明度
histtype: 直方图类型,‘bar’, ‘barstacked’, ‘step’, ‘stepfilled’
返回值 :
n: 直方图向量,是否归一化由参数normed设定
bins: 返回各个bin的区间范围
patches: 返回每个bin里面包含的数据,是一个list
from skimage import data
import matplotlib.pyplot as plt
img=data.camera()
plt.figure("hist")
arr=img.flatten()
n, bins, patches = plt.hist(arr, bins=256, normed=1,edgecolor='None',facecolor='red')
plt.show()
其中的flatten()函数是numpy包里面的,用于将二维数组序列化成一维数组。
是按行序列,如
mat=[[1 2 3
4 5 6]]
经过 mat.flatten()后,就变成了
mat=[1 2 3 4 5 6]
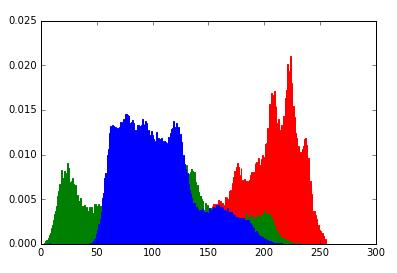
3、彩色图片三通道直方图
一般来说直方图都是征对灰度图的,如果要画rgb图像的三通道直方图,实际上就是三个直方图的叠加。
from skimage import data
import matplotlib.pyplot as plt
img=data.lena()
ar=img[:,:,0].flatten()
plt.hist(ar, bins=256, normed=1,facecolor='r',edgecolor='r',hold=1)
ag=img[:,:,1].flatten()
plt.hist(ag, bins=256, normed=1, facecolor='g',edgecolor='g',hold=1)
ab=img[:,:,2].flatten()
plt.hist(ab, bins=256, normed=1, facecolor='b',edgecolor='b')
plt.show()
其中,加一个参数hold=1,表示可以叠加
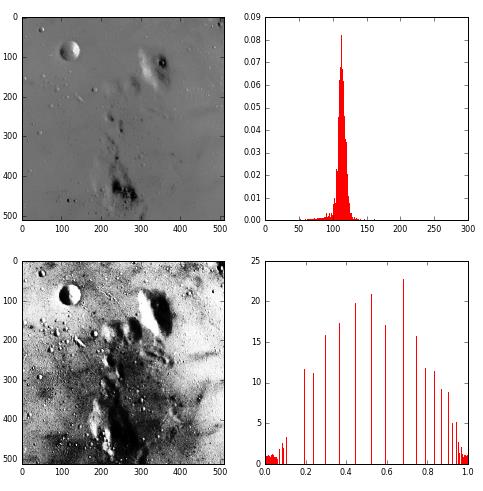
4、直方图均衡化
如果一副图像的像素占有很多的灰度级而且分布均匀,那么这样的图像往往有高对比度和多变的灰度色调。直方图均衡化就是一种能仅靠输入图像直方图信息自动达到这种效果的变换函数。它的基本思想是对图像中像素个数多的灰度级进行展宽,而对图像中像素个数少的灰度进行压缩,从而扩展取值的动态范围,提高了对比度和灰度色调的变化,使图像更加清晰。
from skimage import data,exposure
import matplotlib.pyplot as plt
img=data.moon()
plt.figure("hist",figsize=(8,8))

arr=img.flatten()
plt.subplot(221)
plt.imshow(img,plt.cm.gray)  #原始图像
plt.subplot(222)
plt.hist(arr, bins=256, normed=1,edgecolor='None',facecolor='red') #原始图像直方图

img1=exposure.equalize_hist(img)
arr1=img1.flatten()
plt.subplot(223)
plt.imshow(img1,plt.cm.gray)  #均衡化图像
plt.subplot(224)
plt.hist(arr1, bins=256, normed=1,edgecolor='None',facecolor='red') #均衡化直方图

plt.show()
内容总结
以上是互联网集市为您收集整理的python 图像处理(8):直方图与均衡化全部内容,希望文章能够帮你解决python 图像处理(8):直方图与均衡化所遇到的程序开发问题。 如果觉得互联网集市技术教程内容还不错,欢迎将互联网集市网站推荐给程序员好友。
内容备注
版权声明:本文内容由互联网用户自发贡献,该文观点与技术仅代表作者本人。本站仅提供信息存储空间服务,不拥有所有权,不承担相关法律责任。如发现本站有涉嫌侵权/违法违规的内容, 请发送邮件至 gblab@vip.qq.com 举报,一经查实,本站将立刻删除。
内容手机端
扫描二维码推送至手机访问。