python大佬的可视化工具-Altair
内容导读
互联网集市收集整理的这篇技术教程文章主要介绍了python大佬的可视化工具-Altair,小编现在分享给大家,供广大互联网技能从业者学习和参考。文章包含7337字,纯文字阅读大概需要11分钟。
内容图文

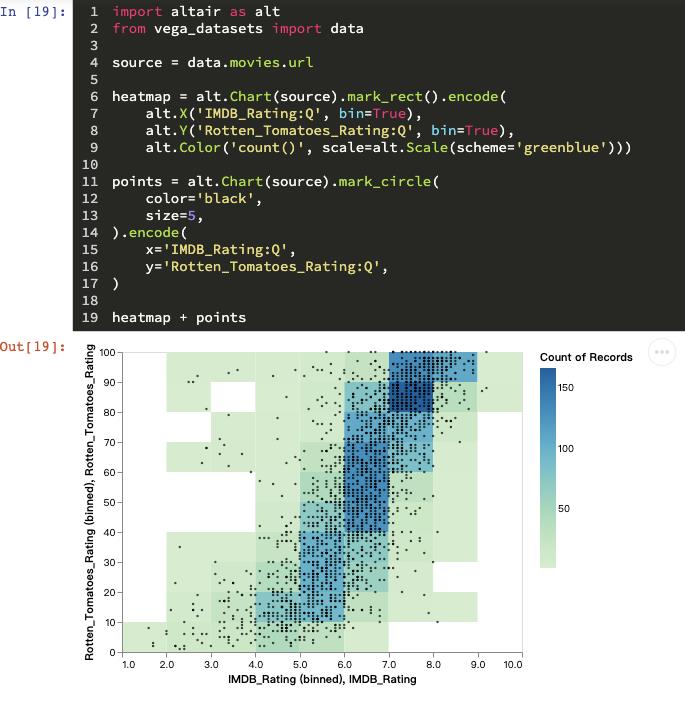
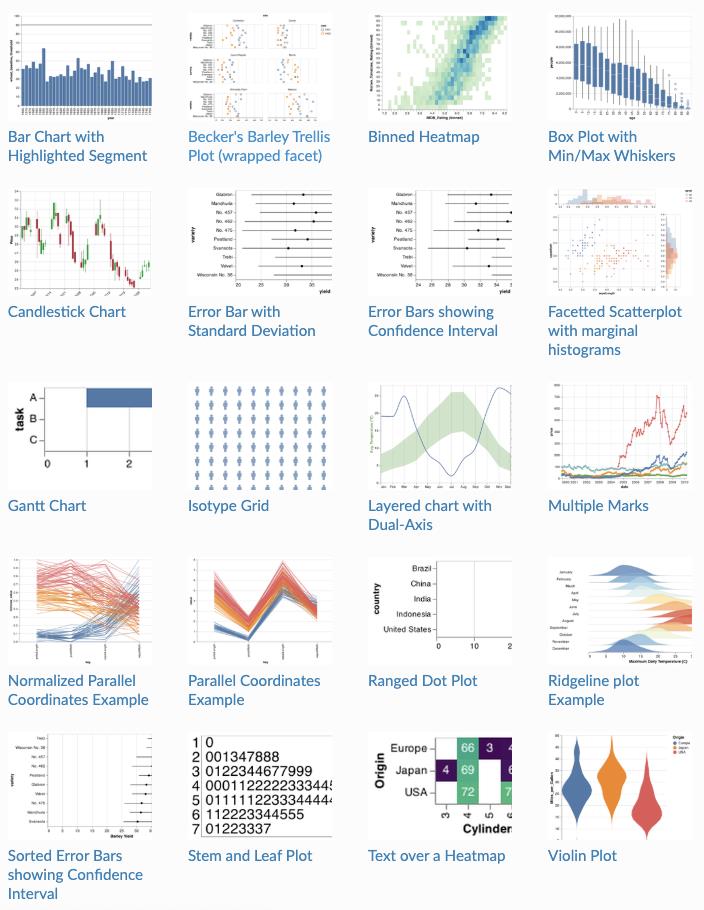
- 本文再分享一个python交互式可视化工具Altair,Altair的底层是Vega-Lite (基于一种简洁的交互式可视化语法,A Grammar of Interactive Graphics),效果例如:
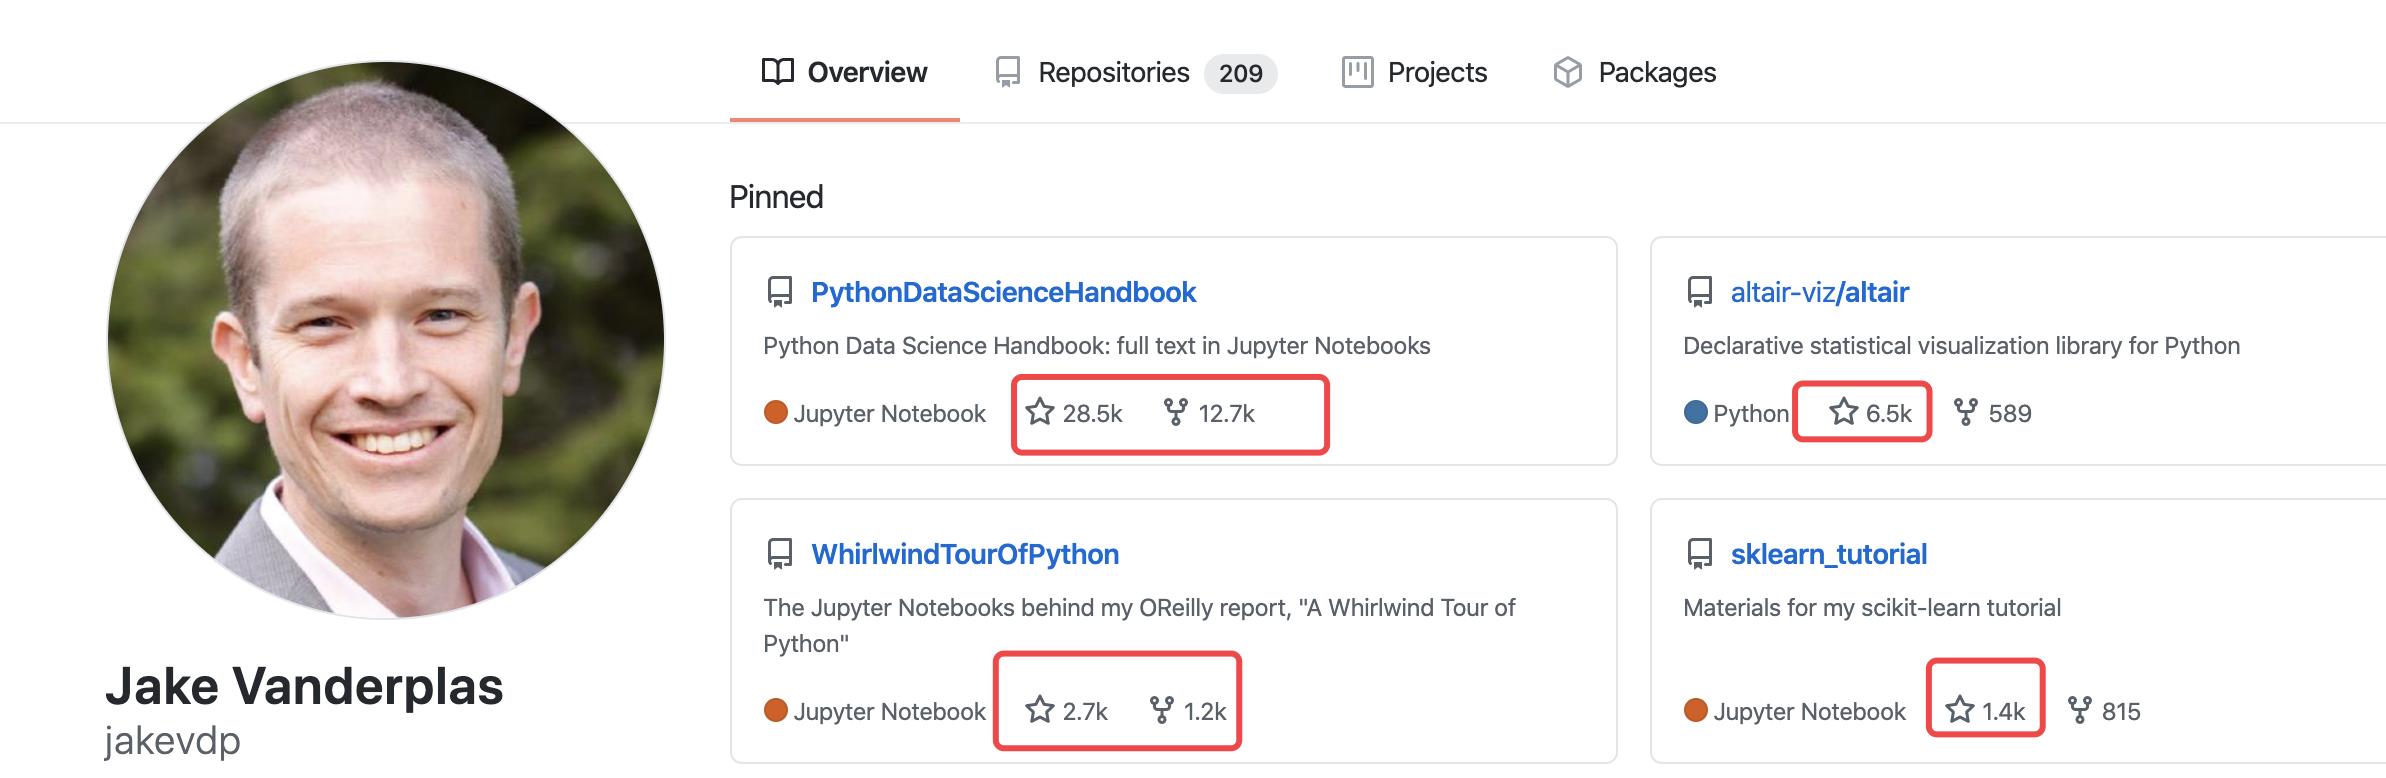
- Altair的作者为Jake Vanderplas,是一个大佬,之前是华盛顿大学 eScience 学院物理科学研究院院长,现为Google的Software Engineer,热衷于Python, Astronomy和Data Science;同时是一位活跃的开源爱好者,历年的 PyData会议都能见到他的talk,除了Altair外,为Scikit-Learn、Scipy、 Matplotlib、IPython 等著名 Python 程序库做了大量贡献;著有两本高stars书籍Python Data Science Handbook 和A Whirlwind Tour of Python 。

目录
selection、condition、binding使得altair图形能和鼠标更好交互
Layer, HConcat, VConcat, Repeat, Facet助力altair轻松构建复合图形
Chart.resolve_scale(), Chart.resolve_axis(), and Chart.resolve_legend()个性化复合图形
官网:https://altair-viz.github.io/index.html?
1、Altair基础图形快速入门
这个小结介绍如何快速的绘制常见的基础图,如“bar”, “circle”, “square”, “tick”,“line”, * “area”, “point”, “rule”, “geoshape”, and “text”等。
pip安装altair
pip install altair vega_datasets -i https://pypi.tuna.tsinghua.edu.cn/simple#国内源加速安装Altair一步一步绘图
-
数据准备
依旧使用鸢尾花iris数据集,数据集介绍见:Python可视化|matplotlib10-绘制散点图scatter
import seaborn as sns
pd_iris = sns.load_dataset("iris")
pd_iris.head(n=5)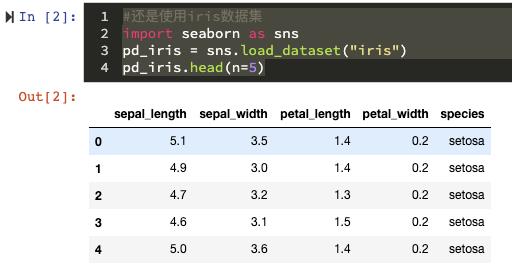
-
快速绘图
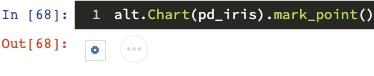
#快速绘图
import altair as alt
import pandas as pd
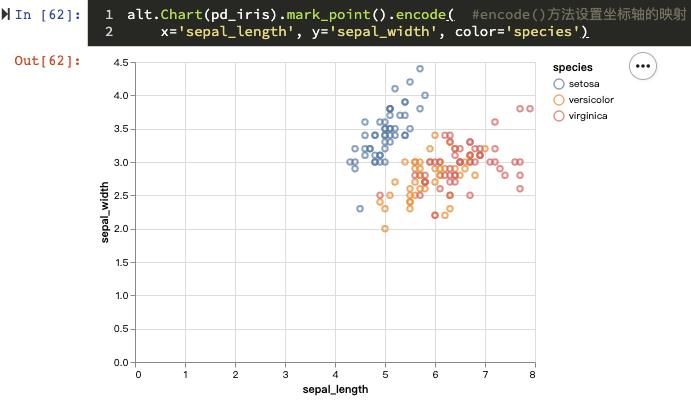
alt.Chart(pd_iris).mark_point().encode(x='sepal_length',
y='sepal_width',
color='species')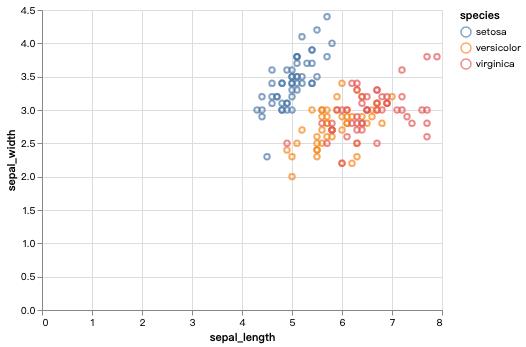
-
绘图步骤拆分
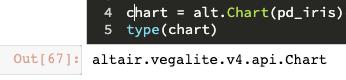
由alt.Chart(pd_iris).mark_point().encode(x='sepal_length',y='sepal_width',color='species')这段代码可知,Altair绘图主要用到Chart()方法、mark_*()方法、和encode()方法。
Chart()方法将数据转化为altair.vegalite.v4.api.Chart对象
括号内可设置图像的高度、宽度、背景色等等,详细见:https://altair-viz.github.io/user_guide/generated/toplevel/altair.Chart.html?highlight=chart
mark_*()方法指定要展示的图形,例如绘制散点图mark_point()
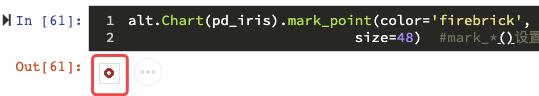
mark_*()方法设置图形属性,如颜色color、大小size等
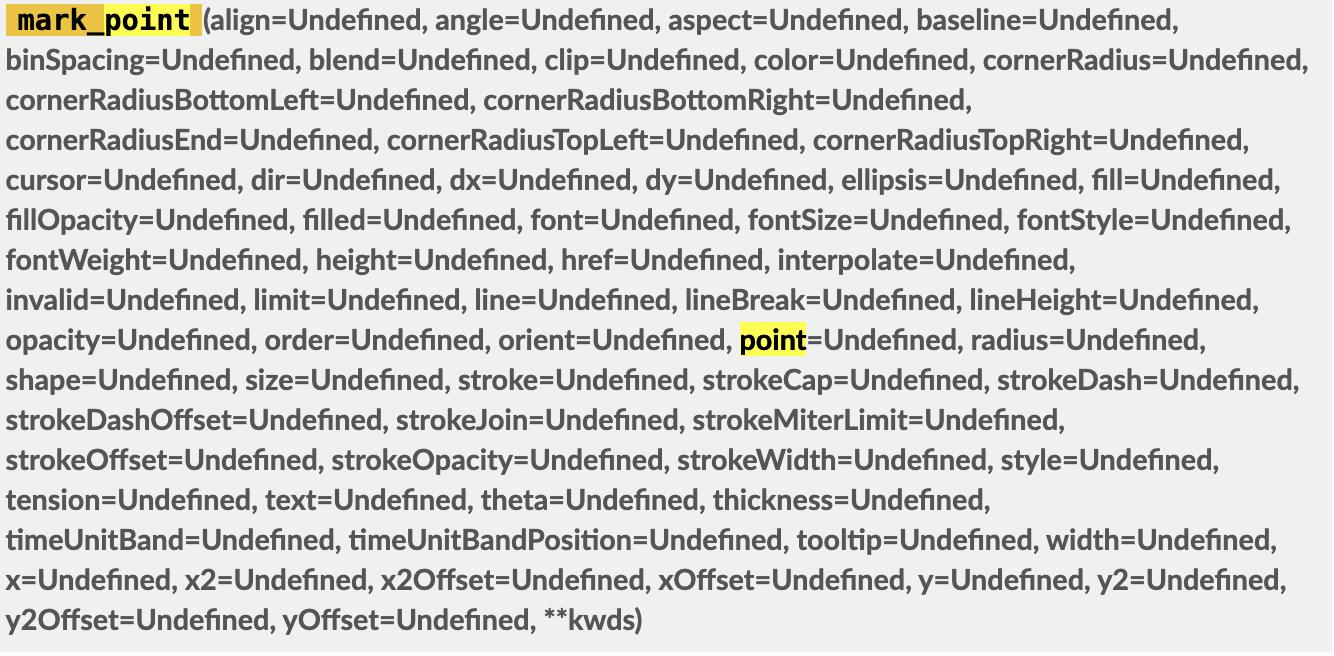
括号内可设置待展示图形的各种属性,以mark_point()设置点颜色为例如下。
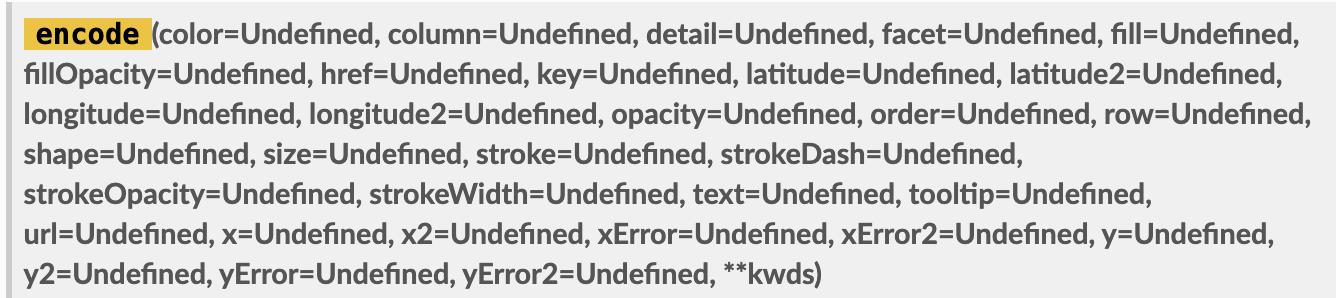
encode()方法设置坐标轴的映射
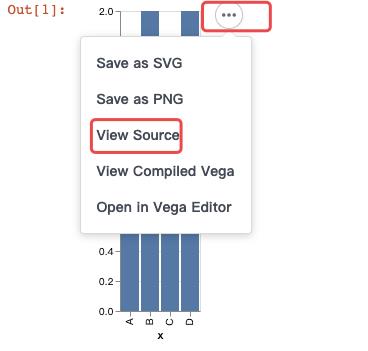
python的Altair脚本转化为JSON
python脚本
import altair as alt
import pandas as pd
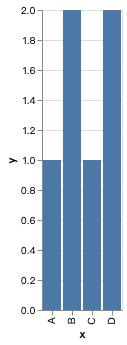
data = pd.DataFrame({'x': ['A', 'B', 'C', 'D'], 'y': [1, 2, 1, 2]})
alt.Chart(data).mark_bar().encode(
x='x',
y='y',
)
json脚本点击即可获取
{
  "config": {"view": {"continuousWidth": 400, "continuousHeight": 300}},
  "data": {"name": "data-39e740acccd9d827d4364cdbd6d37176"},
  "mark": "bar",
  "encoding": {
    "x": {"type": "nominal", "field": "x"},
    "y": {"type": "quantitative", "field": "y"}
  },
  "$schema": "https://vega.github.io/schema/vega-lite/v4.8.1.json",
  "datasets": {
    "data-39e740acccd9d827d4364cdbd6d37176": [
      {"x": "A", "y": 1},
      {"x": "B", "y": 2},
      {"x": "C", "y": 1},
      {"x": "D", "y": 2}
    ]
  }
}
2、Altair复杂图形快速入门
这一节简单介绍更复杂的图形,如个性化分面图标题、图例、会用到configure_*()方法、selection()方法、condition()方法、binding_*()方法、
configure_*()方法个性化图像属性
configure_header()方法个性化header
import altair as alt
from vega_datasets import data#vega_datasets为altair的一个内置数据集模块

source = data.cars.url

chart = alt.Chart(source).mark_point().encode(x='Horsepower:Q',
                                              y='Miles_per_Gallon:Q',
                                              color='Origin:N',
                                              column='Origin:N').properties(
                                                  width=180, height=180)
chart.configure_header(titleColor='green',
                       titleFontSize=14,
                       labelColor='red',
                       labelFontSize=14)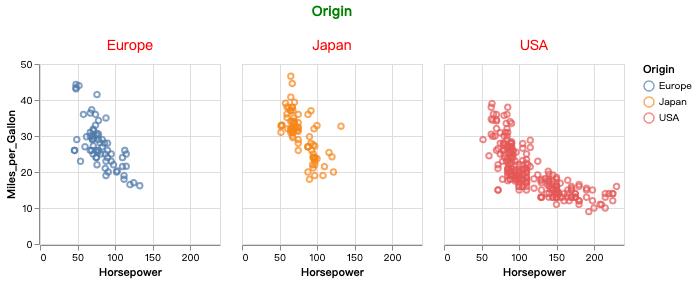
configure_legend()方法个性化图例
import altair as alt
from vega_datasets import data

source = data.cars.url

chart = alt.Chart(source).mark_point().encode(x='Horsepower:Q',
                                              y='Miles_per_Gallon:Q',
                                              color='Origin:N')

chart.configure_legend(strokeColor='gray',
                       fillColor='#EEEEEE',
                       padding=10,
                       cornerRadius=10,
                       orient='top-right')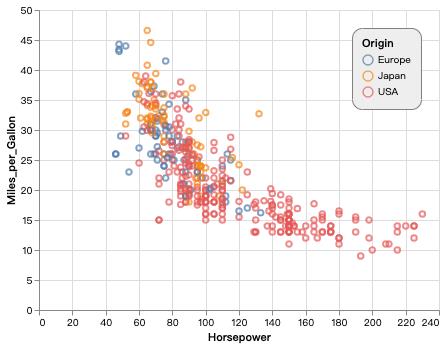
更多configure类方法介绍见:https://altair-viz.github.io/user_guide/configuration.html
selection、condition、binding使得altair图形能和鼠标更好交互
这里主要用到selection()、condition()、binding()方法,简单介绍,详细见:https://altair-viz.github.io/user_guide/interactions.html
-
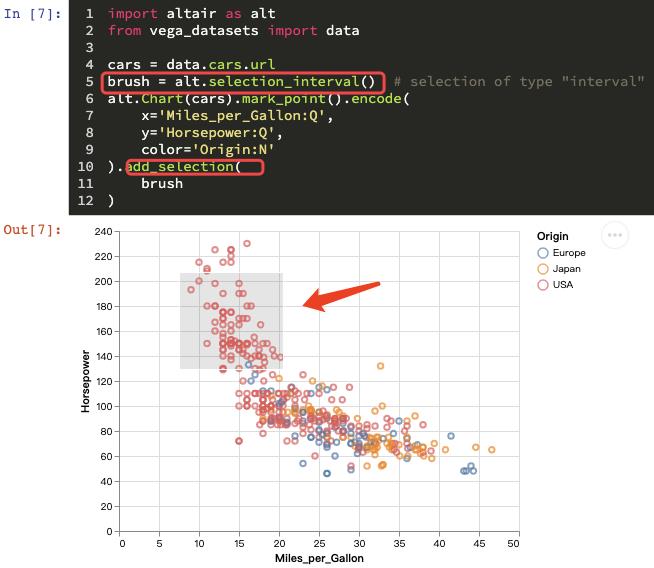
selection()方法
鼠标可以轻捕捉图形某一部分。
-
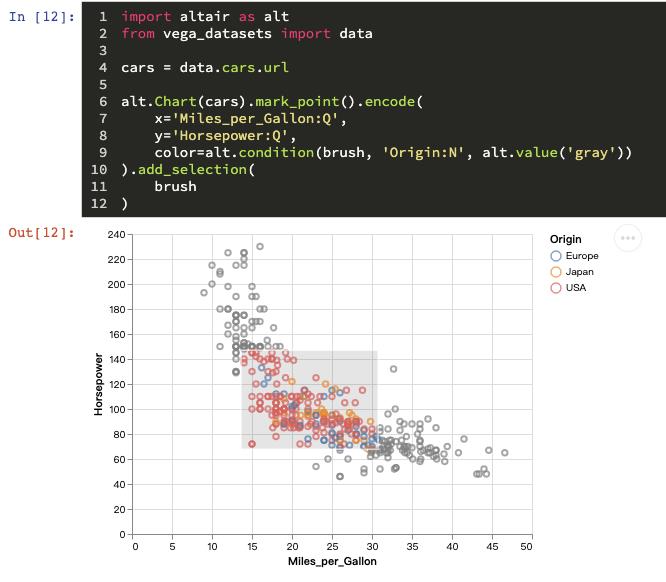
condition()方法
让鼠标捕捉的部分高亮,未捕捉的部分暗淡。
-
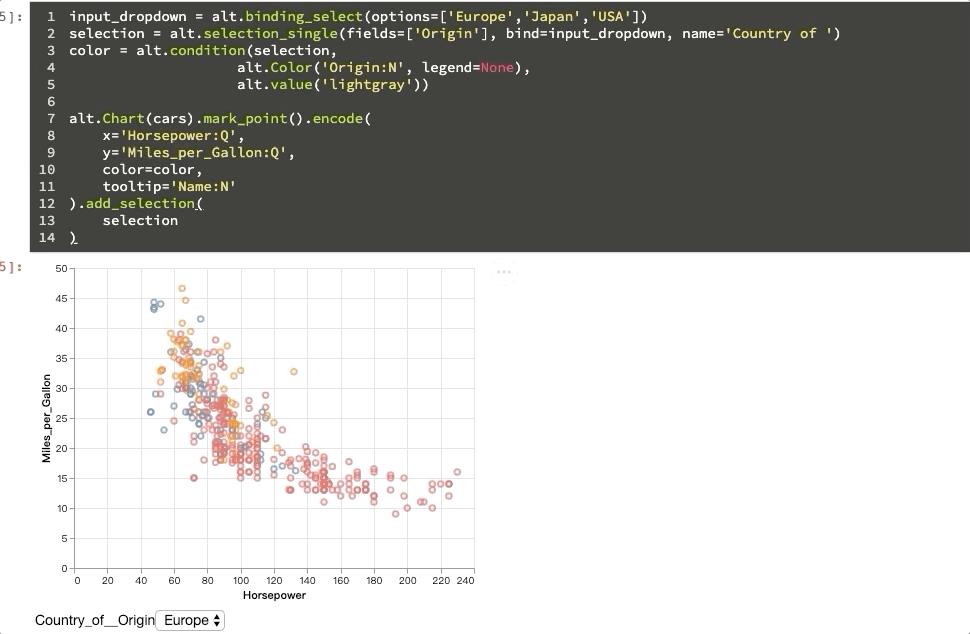
binding_*()方法
效果如下:
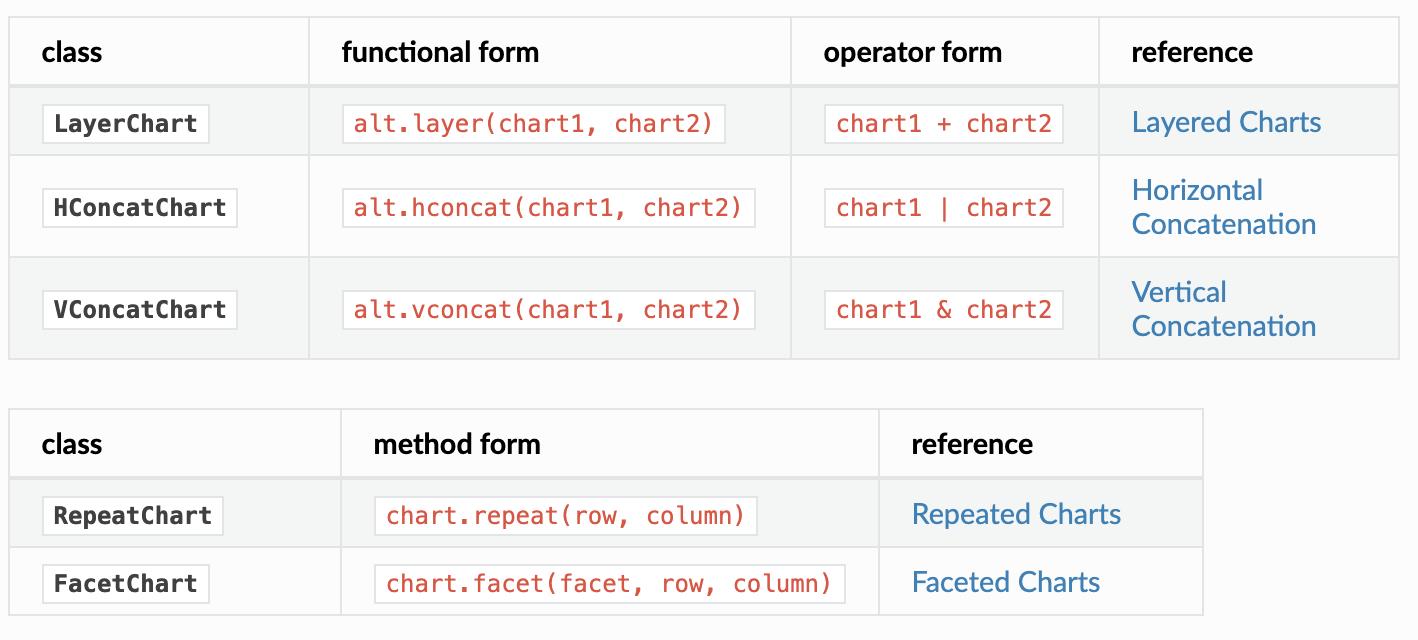
Layer, HConcat, VConcat, Repeat, Facet助力altair轻松构建复合图形
-
hconcat水平方向拼图
import altair as alt
from vega_datasets import data

iris = data.iris.url

chart1 = alt.Chart(iris).mark_point().encode(x='petalLength:Q',
                                             y='petalWidth:Q',
                                             color='species:N').properties(
                                                 height=300, width=300)

chart2 = alt.Chart(iris).mark_bar().encode(x='count()',
                                           y=alt.Y('petalWidth:Q',
                                                   bin=alt.Bin(maxbins=30)),
                                           color='species:N').properties(
                                               height=300, width=100)

chart1 | chart2
alt.hconcat(chart1, chart2)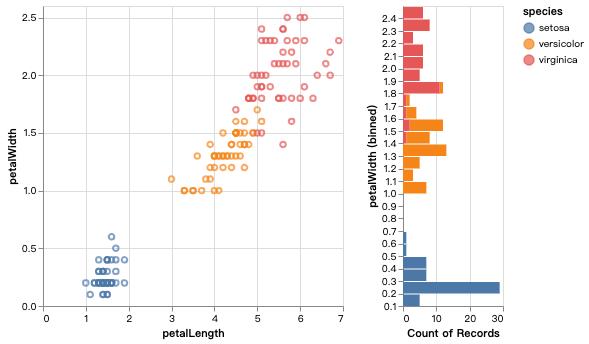
-
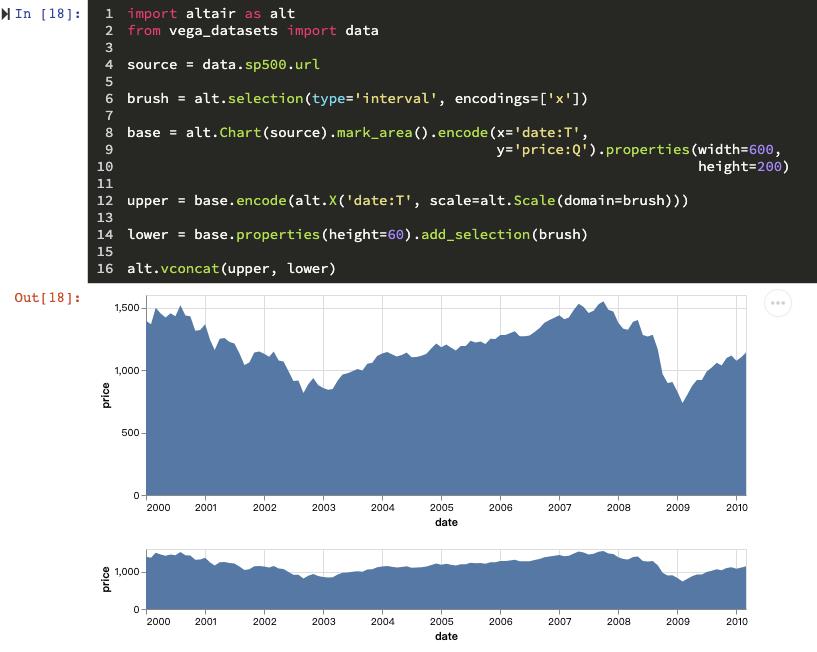
vconcat垂直方向拼图
-
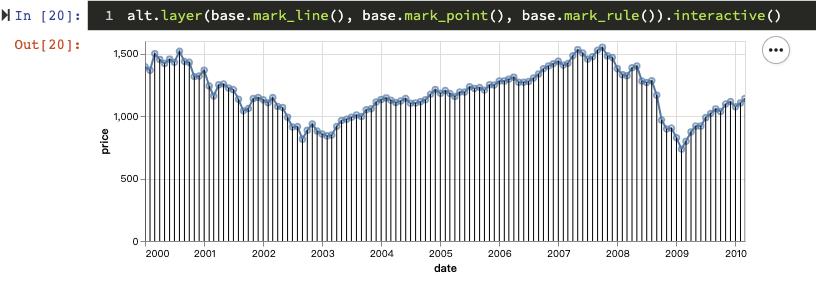
LayerChart图层叠加
-
RepeatChart绘制类似图形
from vega_datasets import data

iris = data.iris.url

base = alt.Chart().mark_point().encode(color='species:N').properties(
    width=200, height=200).interactive()

chart = alt.vconcat(data=iris)
for y_encoding in ['petalLength:Q', 'petalWidth:Q']:
    row = alt.hconcat()
    for x_encoding in ['sepalLength:Q', 'sepalWidth:Q']:
        row |= base.encode(x=x_encoding, y=y_encoding)
    chart &= row
chart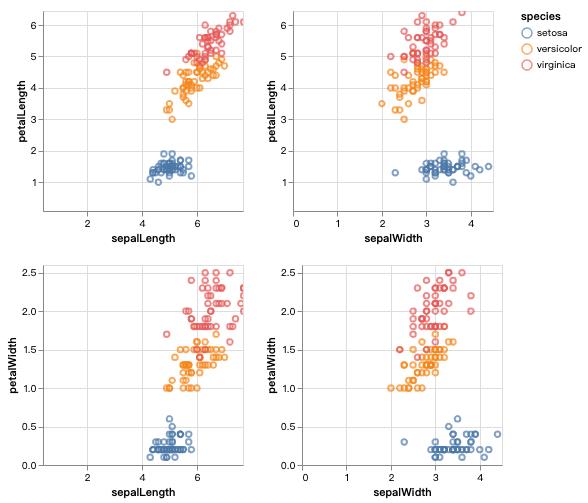
-
FacetChart图形分面
import altair as alt
from altair.expr import datum
from vega_datasets import data

iris = data.iris.url

base = alt.Chart(iris).mark_point().encode(x='petalLength:Q',
                                           y='petalWidth:Q',
                                           color='species:N').properties(
                                               width=160, height=160)

chart = alt.hconcat()
for species in ['setosa', 'versicolor', 'virginica']:
    chart |= base.transform_filter(datum.species == species)
chart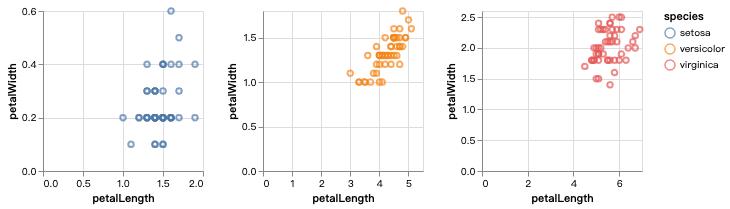
Chart.resolve_scale(), Chart.resolve_axis(), and Chart.resolve_legend()个性化复合图形
例如,使用resolve_scale()分别给两个图使用颜色盘。
from vega_datasets import data

source = data.cars()

base = alt.Chart(source).mark_point().encode(
    x='Horsepower:Q', y='Miles_per_Gallon:Q').properties(width=200, height=200)

alt.concat(base.encode(color='Origin:N'),
           base.encode(color='Cylinders:O')).resolve_scale(color='independent')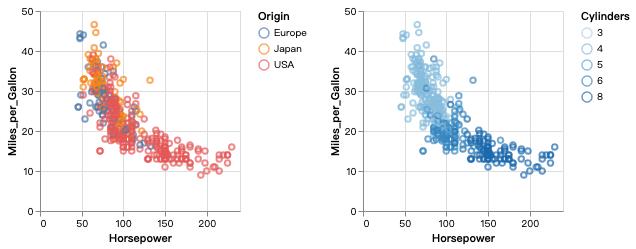
3、基于Altair的demo分享
官网关与天气的一个案例
from vega_datasets import data

df = data.seattle_weather()
scale = alt.Scale(
    domain=['sun', 'fog', 'drizzle', 'rain', 'snow'],
    range=['#e7ba52', '#c7c7c7', '#aec7e8', '#1f77b4', '#9467bd'])
brush = alt.selection(type='interval')
points = alt.Chart().mark_point().encode(
    alt.X('temp_max:Q', title='Maximum Daily Temperature (C)'),
    alt.Y('temp_range:Q', title='Daily Temperature Range (C)'),
    color=alt.condition(brush,
                        'weather:N',
                        alt.value('lightgray'),
                        scale=scale),
    size=alt.Size('precipitation:Q',
                  scale=alt.Scale(range=[1, 200]))).transform_calculate(
                      "temp_range",
                      "datum.temp_max - datum.temp_min").properties(
                          width=600, height=400).add_selection(brush)

bars = alt.Chart().mark_bar().encode(
    x='count()',
    y='weather:N',
    color=alt.Color('weather:N', scale=scale),
).transform_calculate(
    "temp_range",
    "datum.temp_max - datum.temp_min").transform_filter(brush).properties(
        width=600)

alt.vconcat(points, bars, data=df)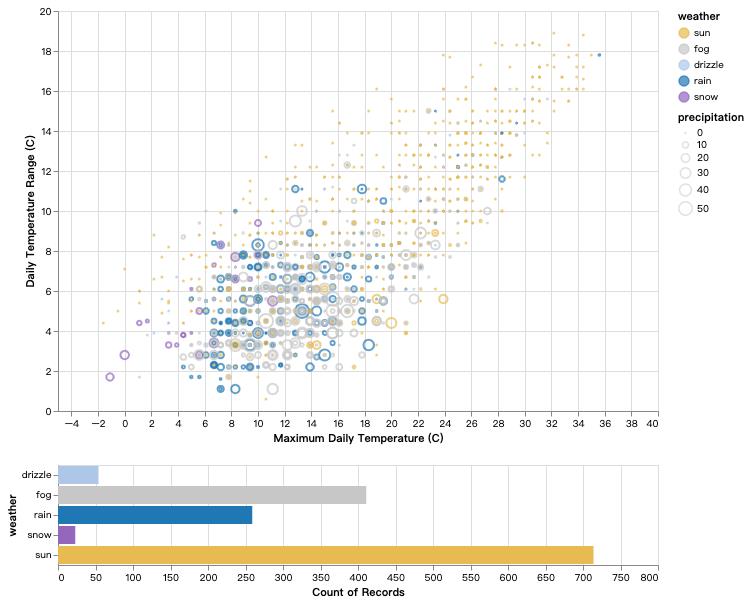
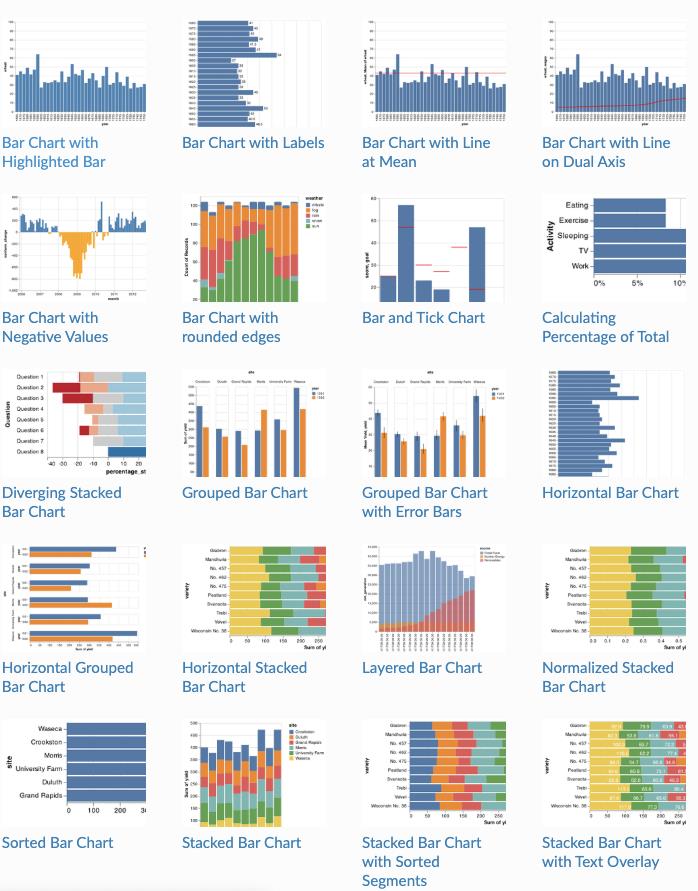
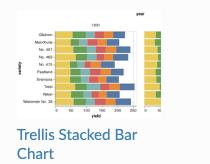
其他的案例见官网,不再过多搬运:
官网:https://altair-viz.github.io/index.html
-
简单图
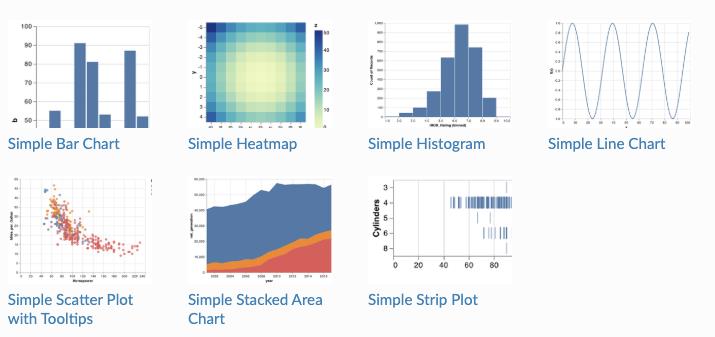
-
bar图
-
line图
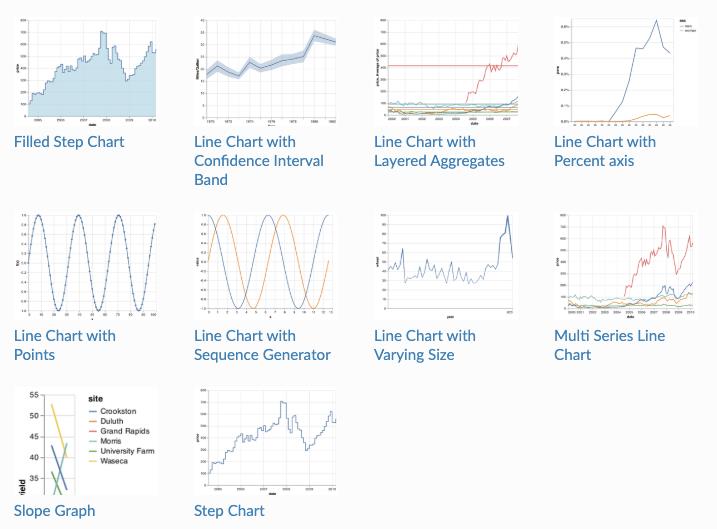
-
area图
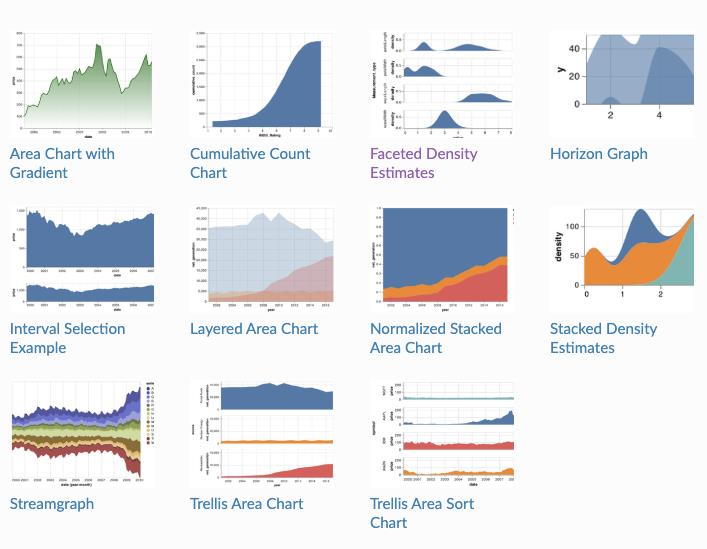
-
scatter图
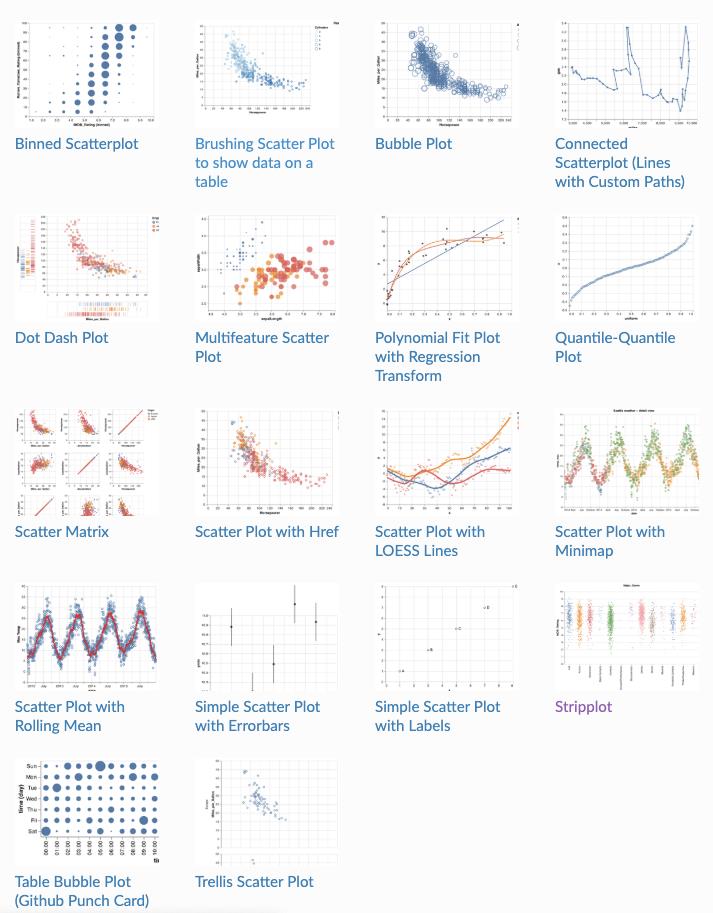
-
histgogram图
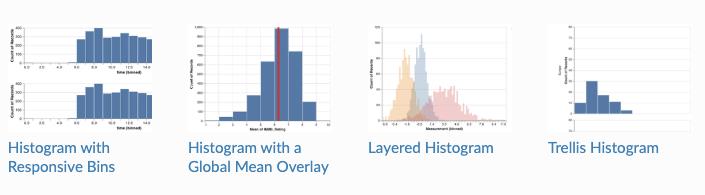
-
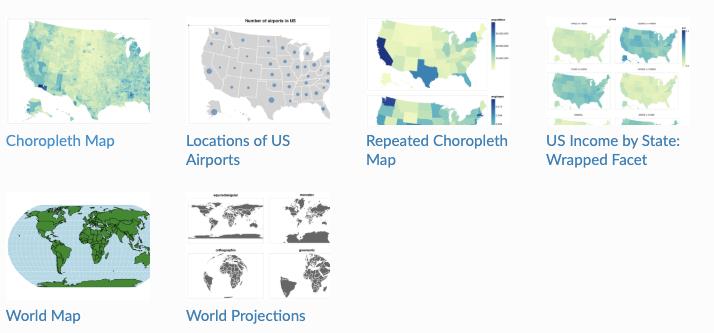
map图
-
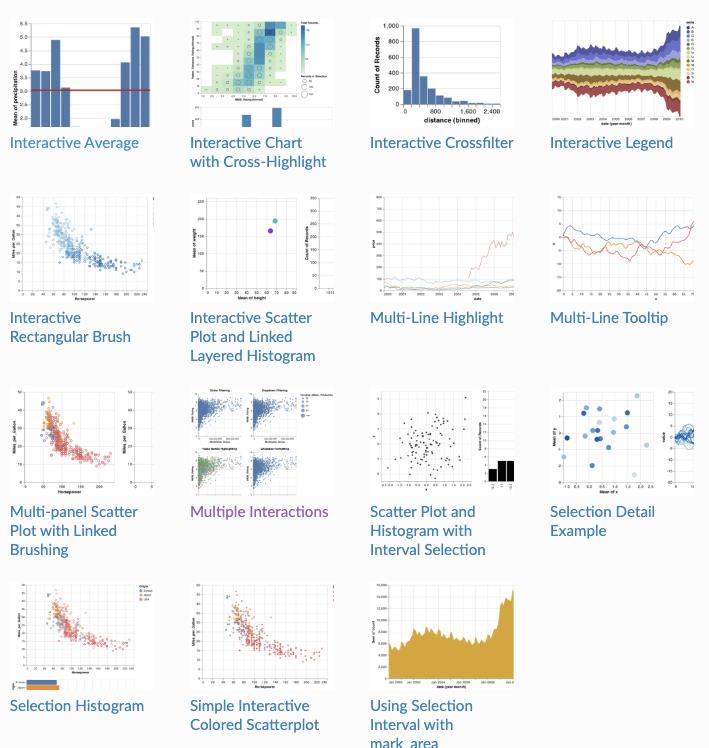
Interactive图
-
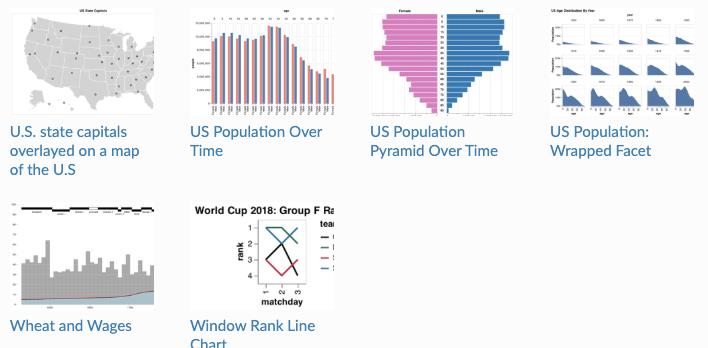
Case Studies
-
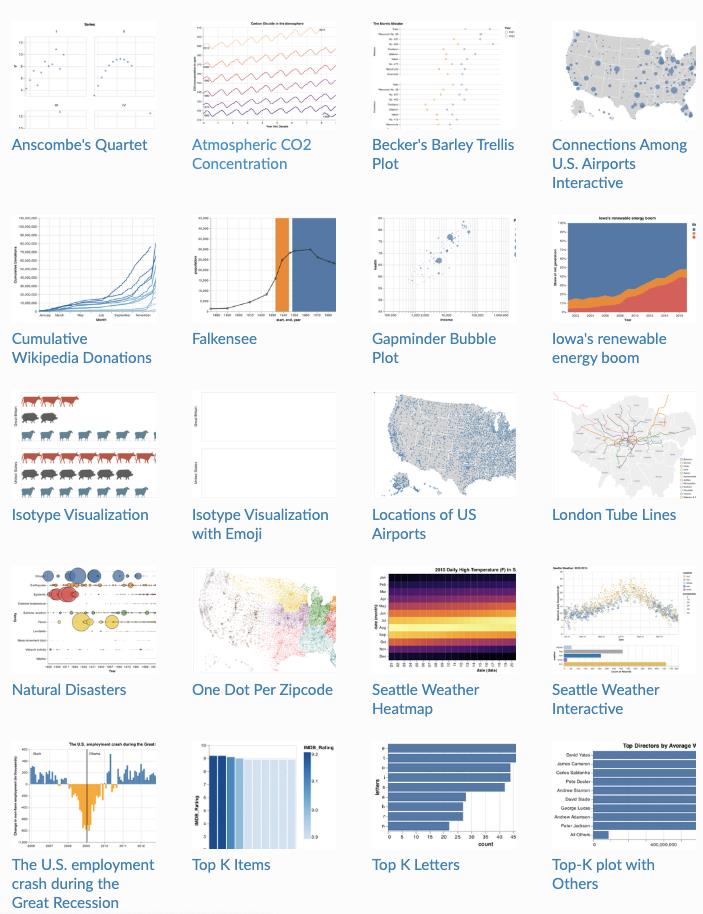
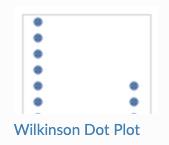
Other Charts
内容总结
以上是互联网集市为您收集整理的python大佬的可视化工具-Altair全部内容,希望文章能够帮你解决python大佬的可视化工具-Altair所遇到的程序开发问题。 如果觉得互联网集市技术教程内容还不错,欢迎将互联网集市网站推荐给程序员好友。
内容备注
版权声明:本文内容由互联网用户自发贡献,该文观点与技术仅代表作者本人。本站仅提供信息存储空间服务,不拥有所有权,不承担相关法律责任。如发现本站有涉嫌侵权/违法违规的内容, 请发送邮件至 gblab@vip.qq.com 举报,一经查实,本站将立刻删除。
内容手机端
扫描二维码推送至手机访问。